Exploring Automation actions and impact — SaaS
The Automation screen offers a detailed overview of all actions PerfectScale Automation performs across your environment, highlighting their impact on resource optimization. This view provides clear insights into automation-driven optimization results and helps seamlessly evaluate its efficiency.
With the provided level of information granularity, you can effortlessly review a detailed breakdown of the actions taken by Automation. This includes insights into the specific tasks executed, the containers affected, and the precise timestamps indicating when each action occurred. Such comprehensive visibility ensures thorough oversight and facilitates further analysis.
The automation screen can only be accessed by users with the Automation feature enabled. Request access to Automation directly from the platform or contact us through [email protected] or PerfectScale Slack Community.
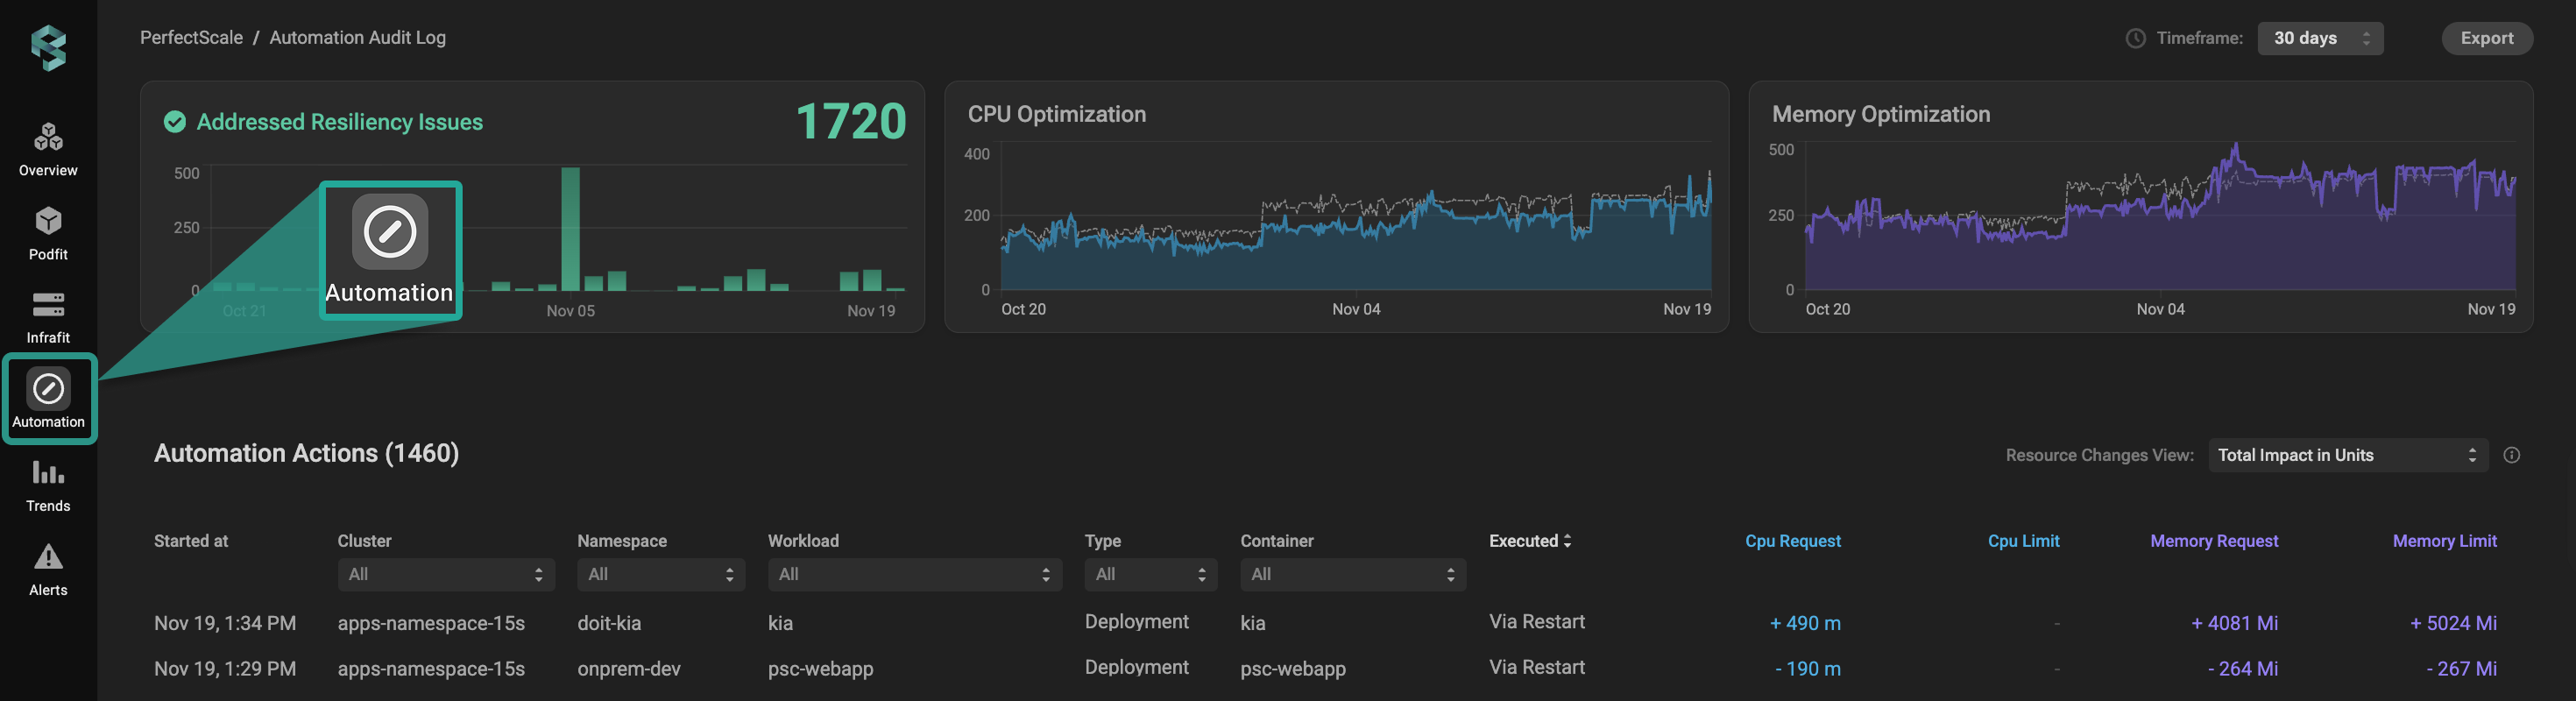
Automation KPIs screen
Exploring automation performance
PerfectScale provides a detailed and transparent view of automation performance, enabling you to evaluate the progress of automation-driven optimization effectively. This comprehensive insight enables you to monitor key metrics and understand how automation improves resource allocation, enhancing the stability and cost-effectiveness of your environment.
Addressed Resiliency Issues
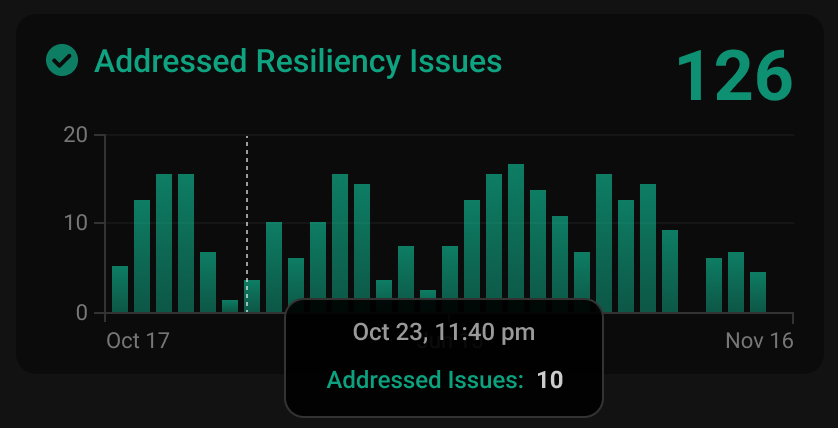
Resiliency issues widget
This widget highlights the resiliency risks that PerfectScale's automation has addressed within the selected time frame. In the top right corner, you can see the total count of risks addressed during this period.
To view the specific number of risks resolved on any given date, hover over the corresponding bar in the chart.
This view allows you to seamlessly evaluate the optimization actions performed by automation to enhance the stability and resiliency of your Kubernetes clusters.
CPU optimization
CPU optimization widget
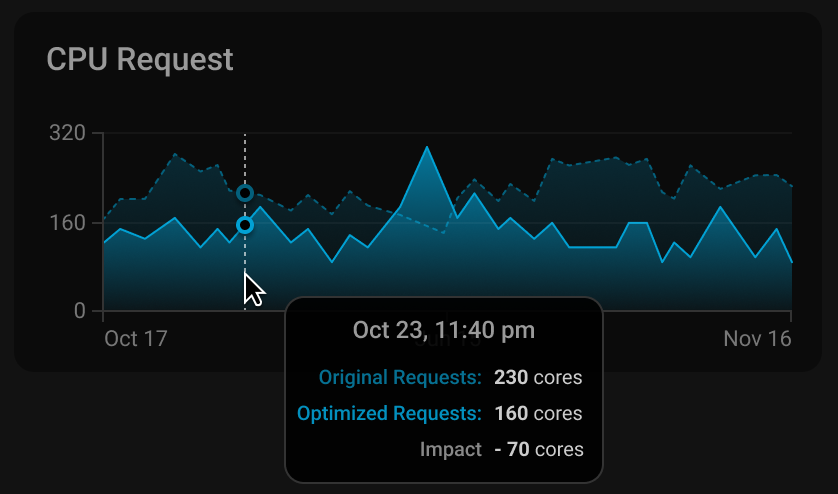
The CPU optimization widget displays changes in CPU requests over time, giving you a detailed view of how Automation has optimized CPU allocation for workloads and their replicas. It provides a detailed visual comparison of the adjustments made against the original configurations, offering transparent insight into the efficiency improvements achieved during the selected period.
To check the details of CPU optimization performed by Automation on a specific date, hover over the corresponding bar in the chart.
Original Requests
The original requests reflect the sum of CPU requests from the initial configurations of all workloads and their replicas at the selected time.
Optimized Requests
The optimized requests represent the sum of CPU requests allocated by Automation for all workloads and their replicas at the selected time.
Impact
Impact quantifies the difference between the CPU requests from the original configuration and those allocated by Automation, providing clear visibility into how effectively Automation optimizes CPU allocation for your clusters.
Memory optimization
Memory optimization widget
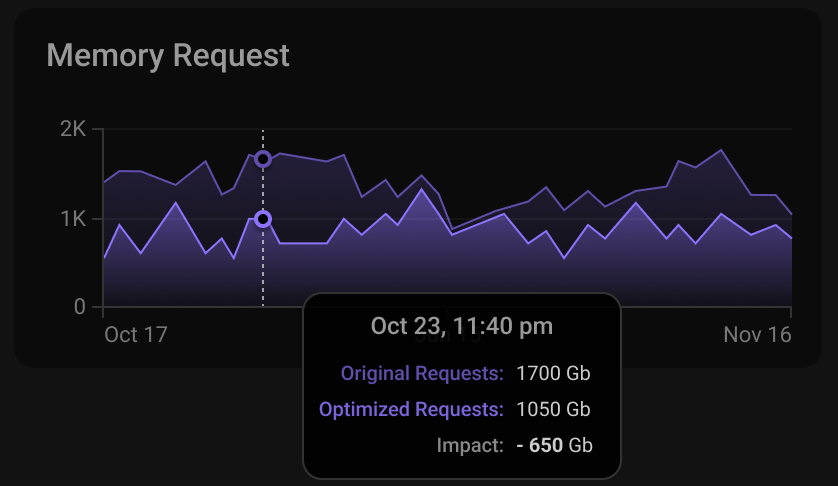
The Memory optimization widget displays changes in Memory requests over time, giving you a detailed view of how Automation has optimized Memory allocation for workloads and their replicas. It provides a detailed visual comparison of the adjustments made against the original configurations, offering transparent insight into the efficiency improvements achieved during the selected period.
To check the details of Memory optimization performed by Automation on a specific date, hover over the corresponding bar in the chart.
Original Requests
The original requests reflect the sum of Memory requests from the initial configurations of all workloads and their replicas at the selected time.
Optimized Requests
The optimized requests represent the sum of Memory requests allocated by Automation for all workloads and their replicas at the selected time.
Impact
Impact quantifies the difference between the Memory requests from the original configuration and those allocated by Automation, providing clear visibility into how effectively Automation optimizes Memory allocation for your clusters.
Automation Actions
| Name | Description |
|---|---|
| Started at | The timestamp indicates when the automated action was initiated. |
| Cluster | Indicates which cluster the automated action was taken in. |
| Namespace | Indicates which namespace the automated action was taken in. |
| Workload | Indicates which workload the automated action was taken in. |
| Type | Indicates the type of workload in which the automated action was taken. 💡Automation is currently available for workloads of the following types: Deployment, DaemonSet, StatefulSet, CronJob, and Job. |
| Container | Indicates which container the automated action was taken in. |
| Executed | Indicates automation execution type: ➣ Via Restart - regular eviction with a restart. ➣ In-Place - in-place resizing without a restart. ➣ Cleanup - automation action caused by enabling the cleanupAllAutomation in a cluster automation configuration |
| CPU Request | Displays the CPU request change if any action was taken. |
| CPU Limit | Displays the CPU limit change if any action was taken. |
| Memory Request | Displays the Memory request change if any action was taken. |
| Memory Limit | Displays the Memory limit change from its previous value to the new one if any action was taken. |
To access full data and examine the details, click the log and navigate to the PodFit Zoom-in window.
Actions associated with deleted or disconnected clusters remain visible for historical reference. Rows for these clusters are grayed out, and navigation to the Zoom In view is disabled because the cluster is no longer being observed by PerfectScale.
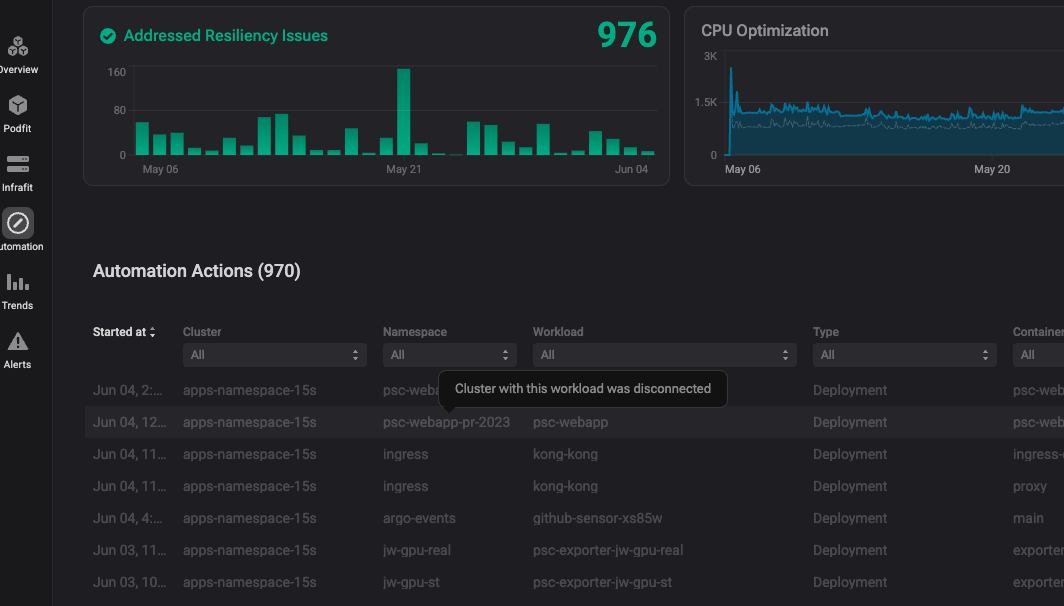
Personalize Automation Audit Log view
PerfectScale empowers you to customize your Automation Audit Log view, enabling you to focus on what matters to you.
To customize tables and focus on the data that matters most, use the Columns menu. Learn more about table customization here.
🔝 To sort the data in the desired order, simply click on the title of the column.
📌 To filter the data by a specific value, use a drop-down list at the top of the columns.
Available filters:
- Cluster
- Namespace
- Workload
- Type
- Container
📐 Choose your preferred format for displaying changes to resources with the advanced filters
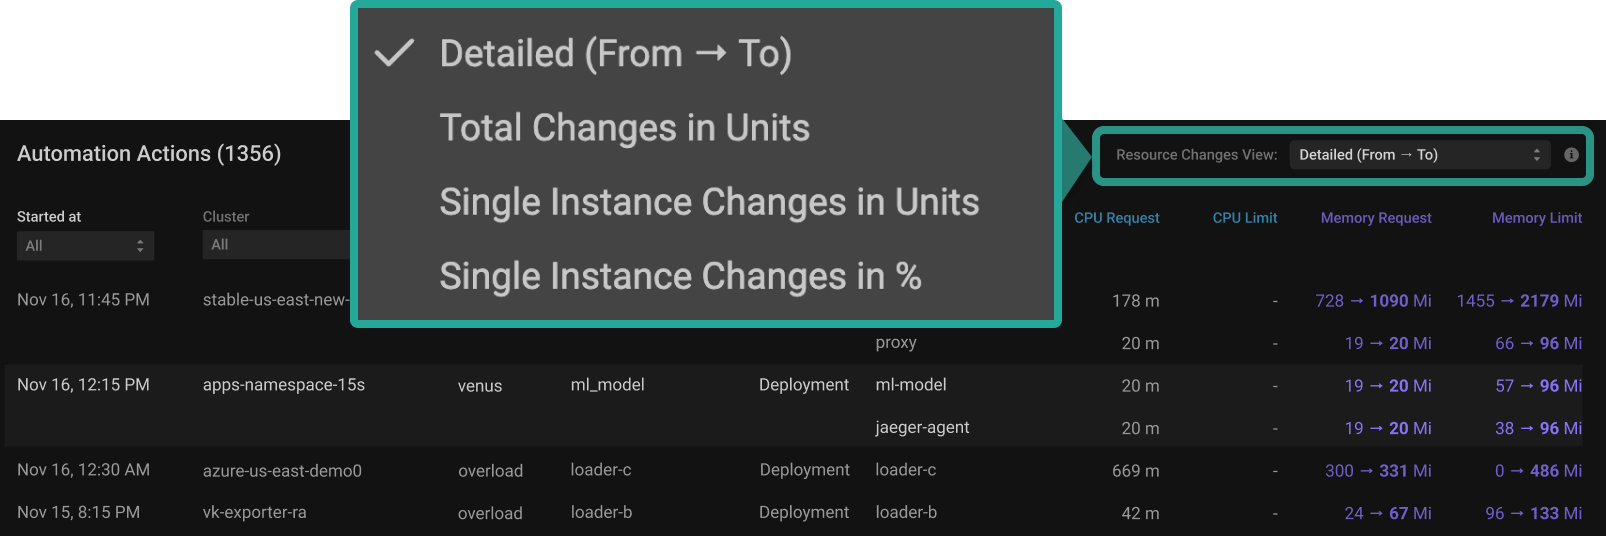
Recommendations formats
- Detailed - to display the changes made to resources (shows both the previous and new values).
- Total Changes in Units - to display changes made to resources as an absolute number, factoring in replica count.
- Single Instance Changes in Units - to display changes made to resources as an absolute number.
- Single Instance Change in % - to display changes made to resources in a percentage format.
Hover over the results to get more details on the resource changes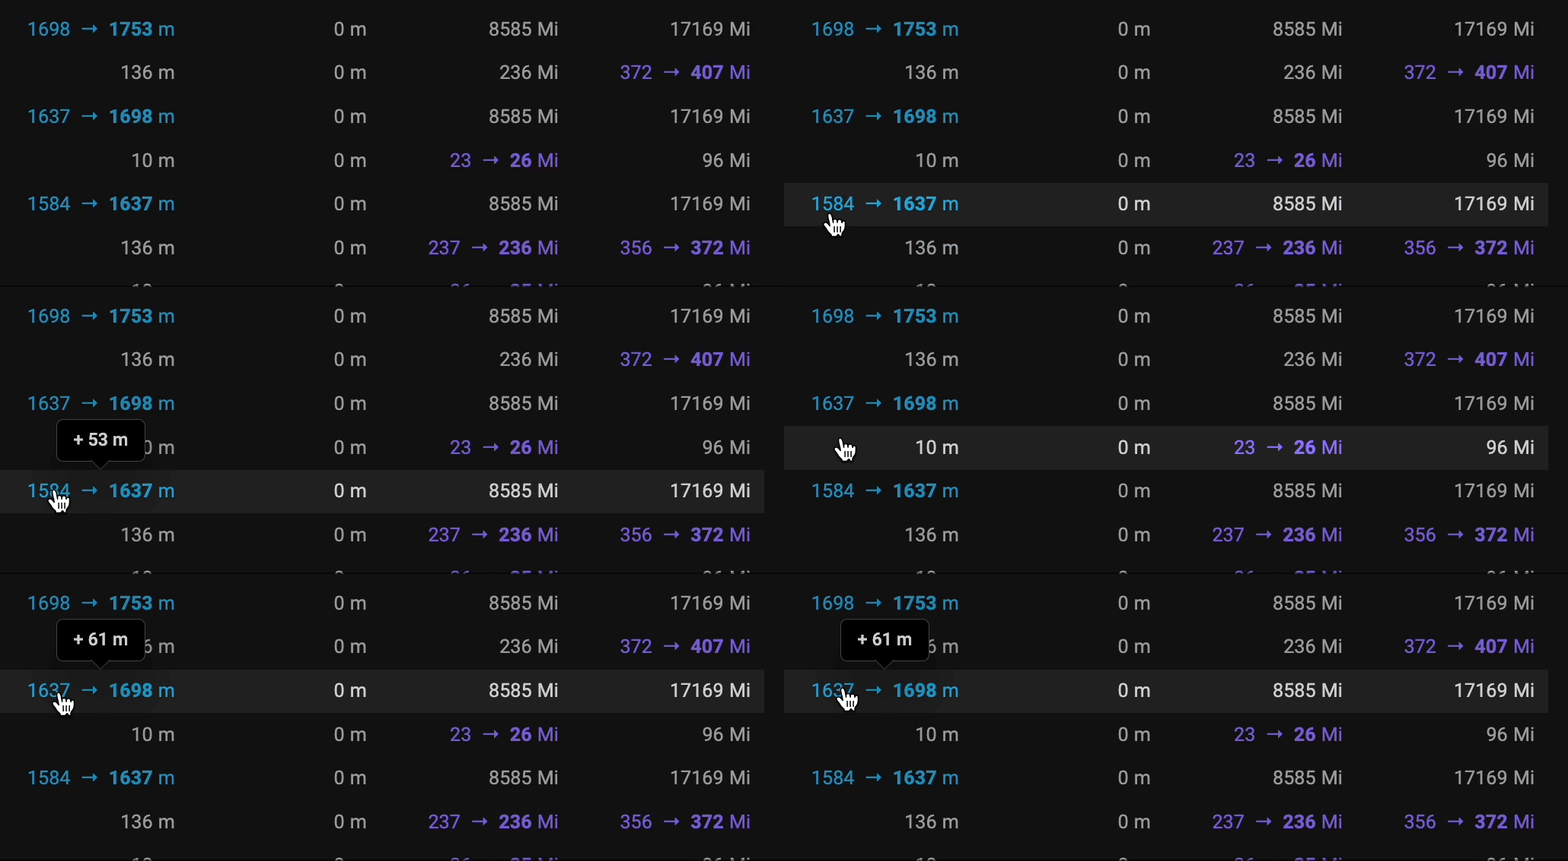
Export the report
The export feature gives you the ability to export your data into a .csv file for seamless analysis and effortless sharing. Click the Export button, and the data will be exported in a second.
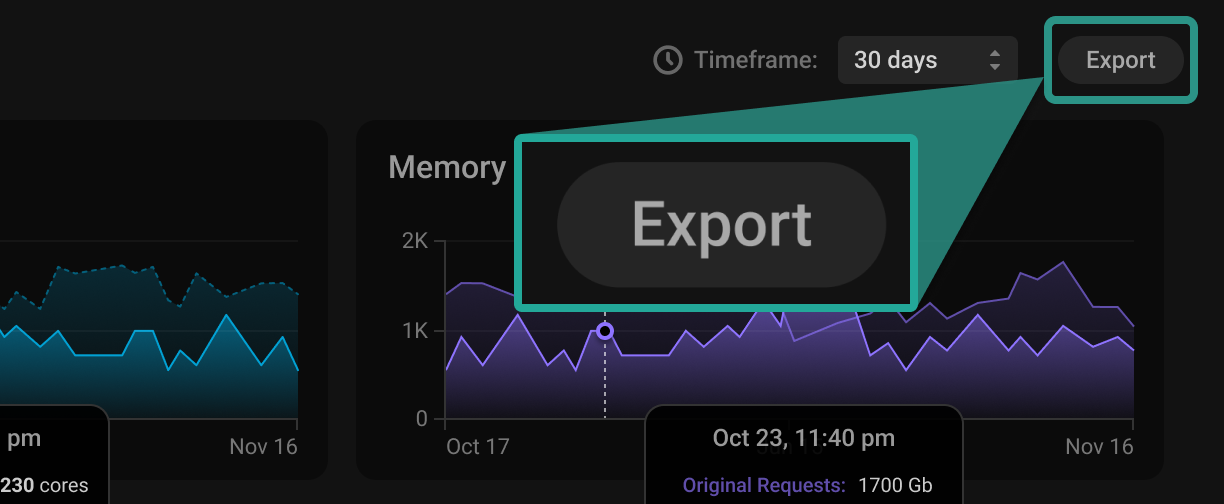
Report export