Cluster utilization dashboard
The cluster utilization dashboard provides resource usage metrics at the workload level.
Required permission
- Cloud Analytics User
Access cluster utilization dashboard
To access the cluster utilization dashboard, select the cluster of interest from the list of clusters on the Kubernetes Intelligence dashboard.
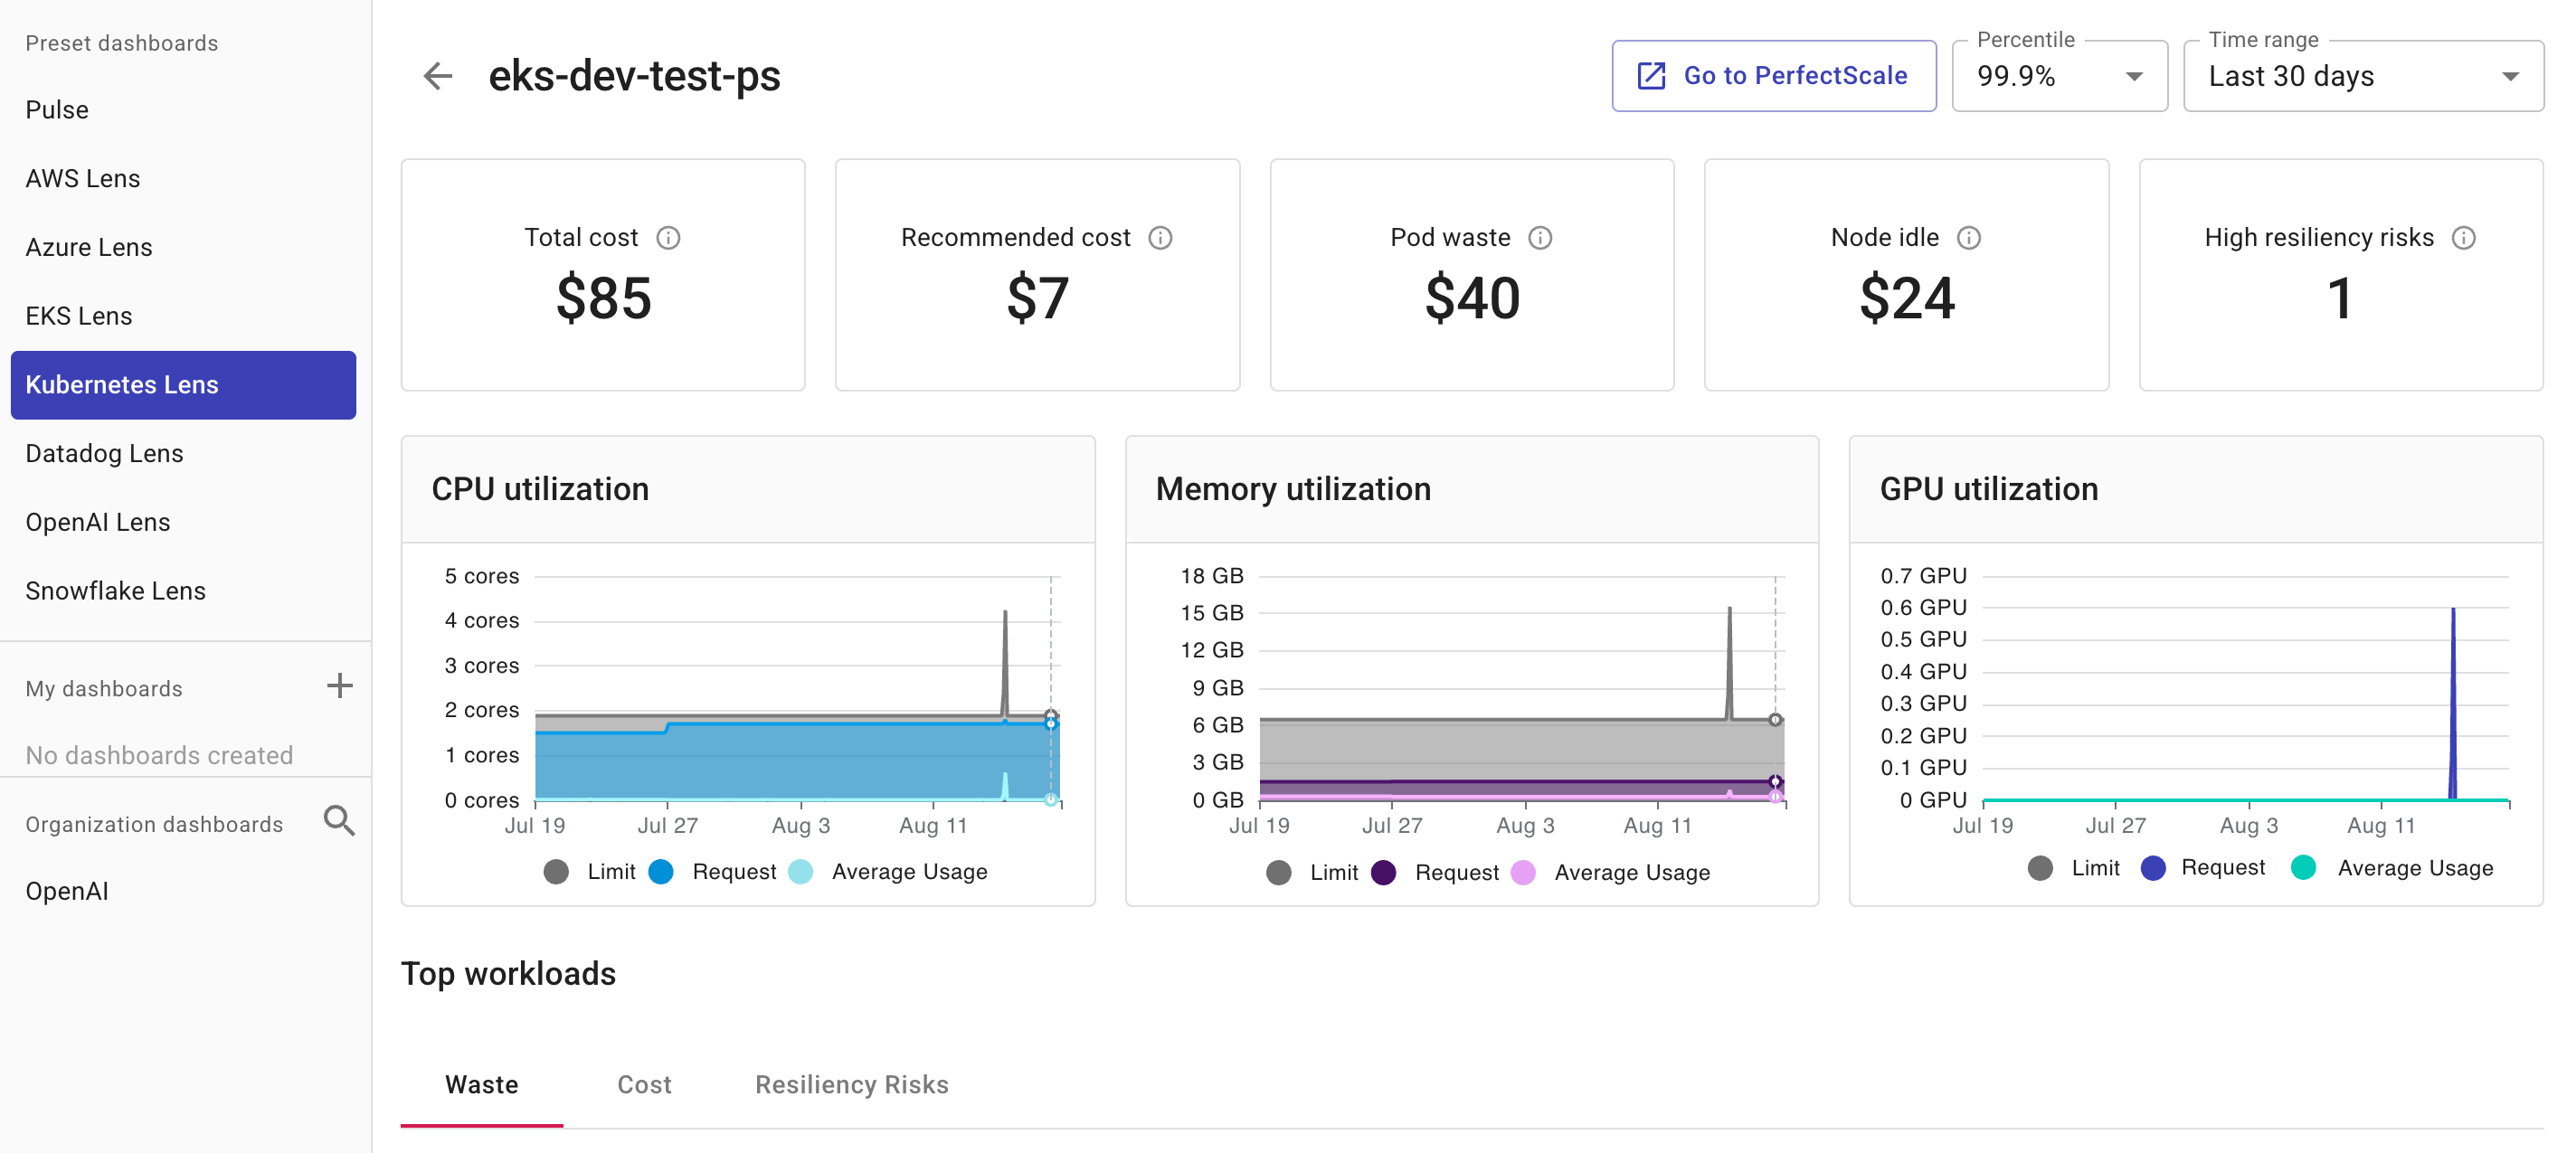
The cluster utilization dashboard consists of the following parts:
-
Summary information: Overview panels that show the summary for the current cluster.
-
Utilization charts: Charts that show the cluster memory, CPU, and GPU utilization during the selected time range.
General settings
The general settings are found in the upper-right corner of the dashboard:
-
Go to PerfectScale: Launch the PerfectScale sign-in page. If you haven't signed up with PerfectScale yet, this option will send you an invitation to get started.
-
Percentile: Specify the value below which a certain percentage of data in the set of utilization time series falls. For example, the 95% percentile means 95% of the values are below that point. This setting is helpful for understanding usage patterns.
-
Time range: Specify the period of data collection. Note that the time range affects data granularity.
-
Last 1, 4, 12 hours; last day: 10-minute granularity
-
Last 3, 7 days: hourly granularity
-
Last 14, 30 days: daily granularity
-
Summary information
-
Total cost: The cost of the cluster during the selected time range, based on cloud billing data.
-
Recommended cost: The recommended cost that could be achieved based on PerfectScale recommendations.
-
Pod waste: The cost of overprovisioned pods, based on utilization data collected by the Kubernetes Intelligence agent.
-
Node idle: The cost of idle nodes, based on utilization data collected by the Kubernetes Intelligence agent.
-
High resiliency risks: The total number of workloads with high resiliency risks in the cluster, identified by PerfectScale when the
At Riskindicator isHigh. See Resiliency alerts for more information.
Utilization charts
The main section of the cluster utilization dashboard contains three charts to show the cluster memory, CPU, and GPU utilization during the selected time range and percentile.
-
CPU utilization: Displays the limit, request, and average usage of CPU resources (cores). High CPU utilization could indicate that the cluster runs compute-intensive workloads or the cluster needs more CPU resources.
-
Memory utilization: Displays the limit, request, and average usage of memory resources (GB). High memory utilization could indicate that the cluster runs memory-intensive workloads or the cluster needs more memory resources.
-
GPU utilization: Displays the limit, request, and average usage of GPU resources. High GPU utilization could indicate that the cluster runs graphics- or computation-intensive workloads, such as machine learning or data processing tasks, or that the cluster needs more GPU resources.
NotePerfectScale currently only supports NVIDIA Data Center GPU Manager (DCGM). See PerfectScale: GPU optimization for details.
You can hover over the charts to view the figures at different time points:
-
Limit: Total amount of CPU, memory, or GPU resources allocated to the cluster.
-
Request: Total amount of CPU, memory, or GPU resources requested by workloads on the cluster.
-
Average usage: Total average amount of CPU, memory, or GPU resources consumed by workloads running on the cluster.
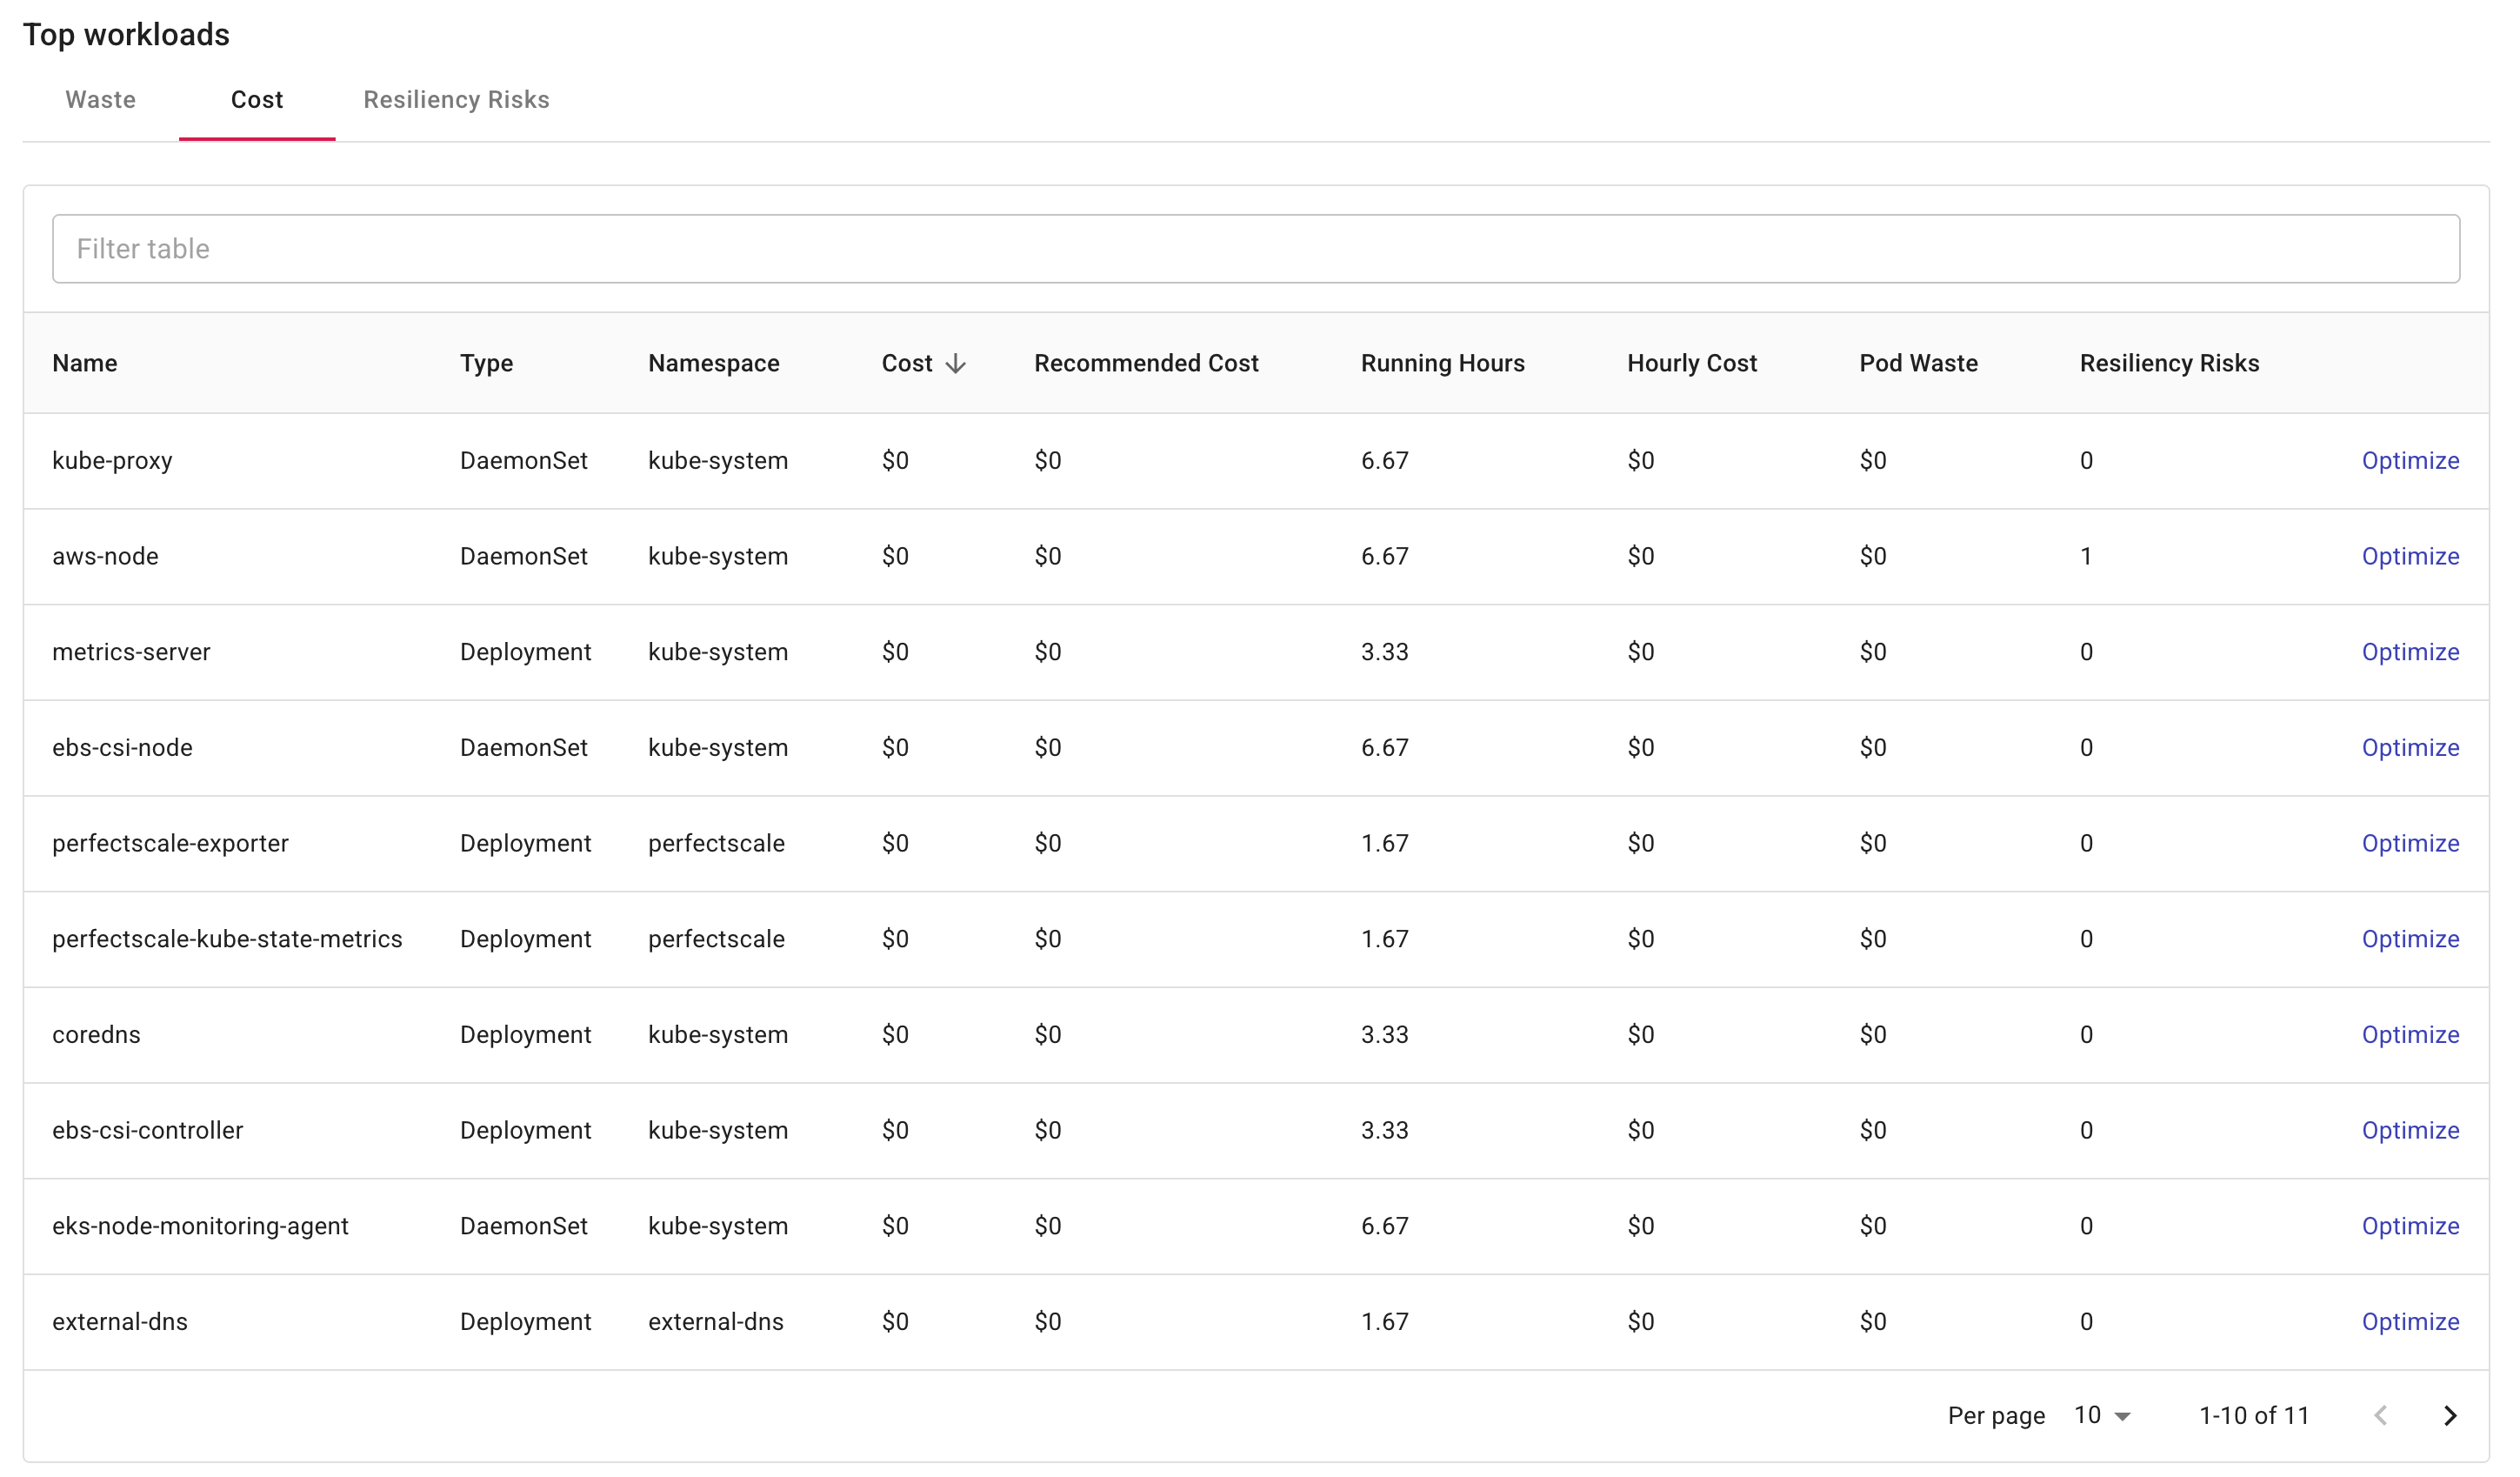
Waste, cost, and resiliency risks
At the bottom of the Cluster utilization dashboard you'll find detailed resource usage information for the top workloads running on the cluster during the selected time range.
Each tab shows its own top 20 workloads: select the Waste tab to view workloads ranked by waste, the Cost tab for workloads ranked by cost, and the Resiliency risks tab for workloads by the number of high resiliency risks.
-
Name: The name of the workload.
-
Type: The type of the workload resources, for example, Pod, Deployment, DaemonSet, Jobs.
-
Namespace: The namespace of the workload.
-
Cost: The total cost of the workload.
-
Recommended cost: The recommended cost that could be achieved based on PerfectScale recommendations.
-
Running hours: The number of hours that the workload has been running.
-
Hourly cost: The hourly cost of the workload.
-
Pod waste: The cost of overprovisioned pods for the workload.
-
Resiliency risks: The number of high resiliency risks identified in the workload. See Resiliency alerts for more information.
You can select Optimize or Go to PerfectScale at the bottom of the page to launch the PerfectScale page.