Node group view — SaaS
To customize tables and focus on the data that matters most, use the Columns menu. Learn more about table customization here.
This view provides a comprehensive and granular breakdown of all node groups within a cluster. It facilitates immediate identification of resource inefficiencies, enables quick prioritization of optimization tasks for optimal results, and unlocks further deep investigation.
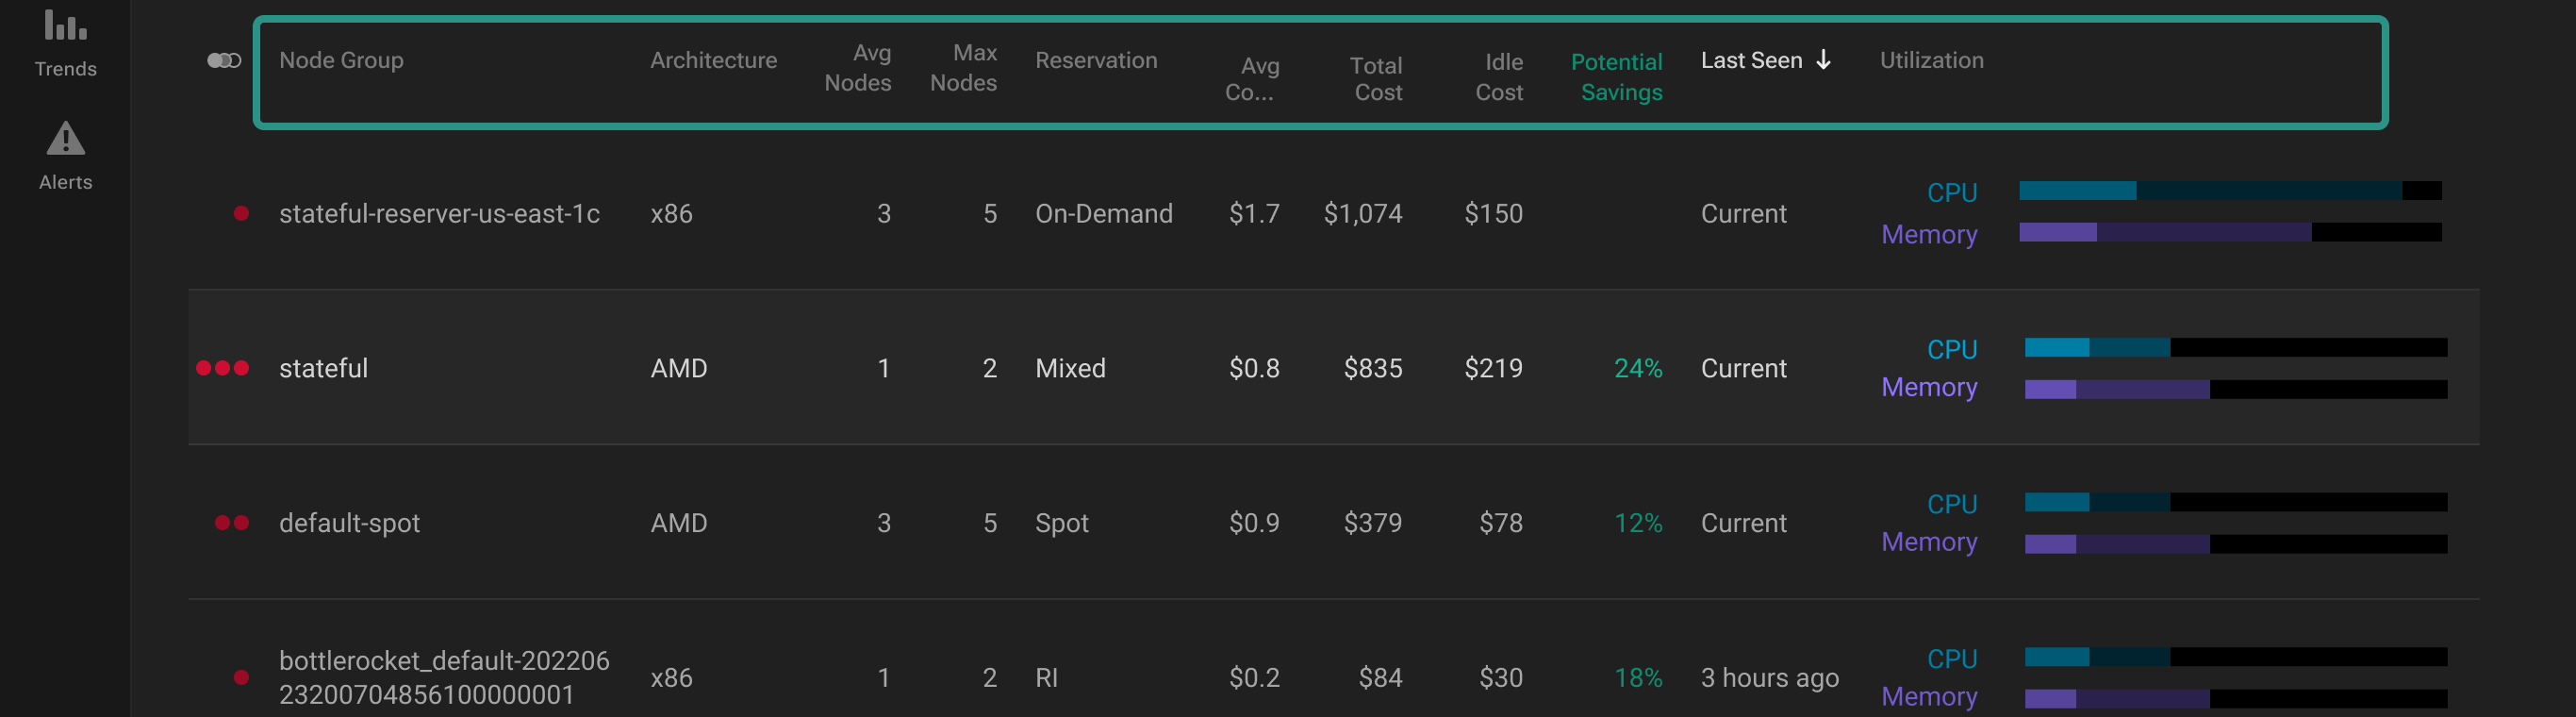
Node group view
Data table
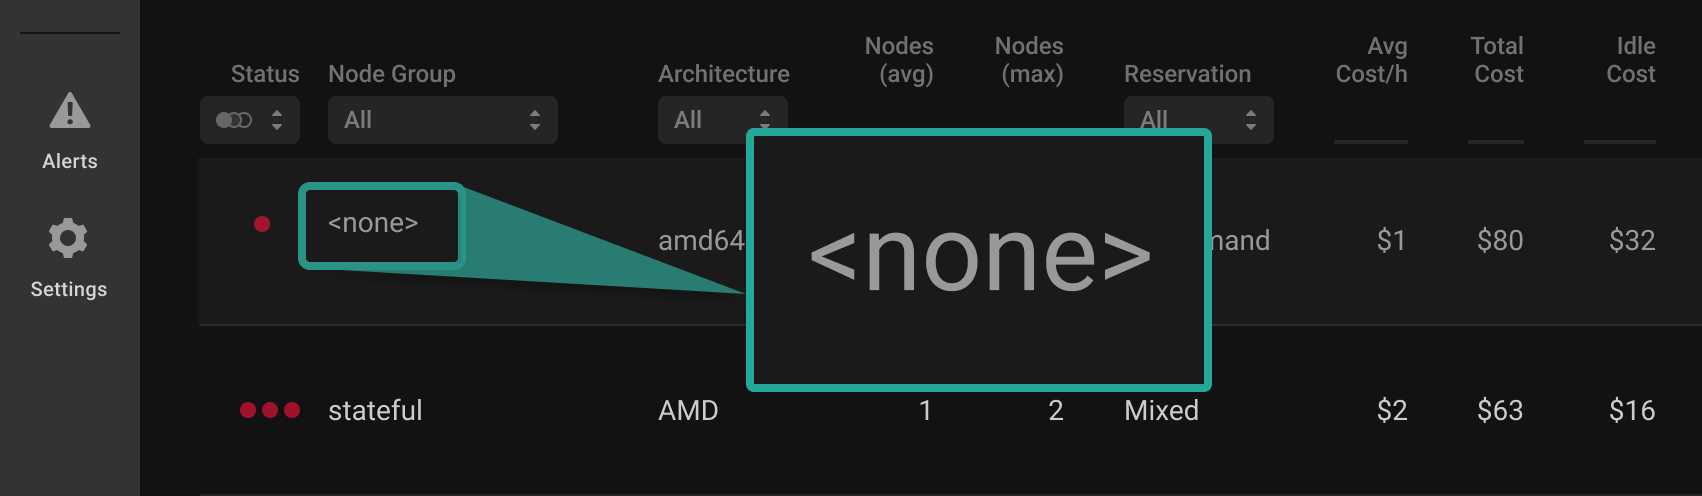
Node group <none> contains nodes whose labels were not identified (for example, custom labels). In that case, we recommend you group such nodes manually by configuring the Label Customizations Profile.
| Column | Description |
|---|---|
| Node Group | This displays the Node Group Name. To sort or filter data, click on a column title or use a drop-down list. |
| Architecture | This displays the Node Architecture (ARM, x86). You can sort or filter data by clicking on a column title or using a drop-down list. |
| Nodes (avg & max) | This displays the average and maximum number of nodes in a specific node group. Click on a column title to sort the data. |
| Reservation | Display the reservation type of nodes in the group. To sort or filter data, click on a column title or use a drop-down list. |
| Avg Cost/h | Displays the average node group cost per hour. Click on a column title to sort data. |
| Total Cost | Displays the total node group cost. Click on a column title to sort data. |
| Idle Cost | Displays the cost of the space in a node group that has never been used. Click on a column title to sort the data. |
| Potential savings | Displays the estimated dollar savings by applying node recommendations. |
| Last Seen | Displays the last time PerfectScale observed the Node Group. |
| Utilization | A visual representation of CPU, Memory, GPU, and GPU memory Utilization (allocation, request, and usage) based on the selected usage percentile. Use a drop-down list to filter data with the needed value. |
Node Groups Total
Shows the total cost and idle of the nodes.
Diving into the node group
By clicking on the node group, you will be navigated to the Node Group Details screen. Here, you can get a detailed view of the running workloads within this group or review the distribution of node types along with relevant data for further analysis.
Once you are in the Node Group, you can easily explore the data with various levels of granularity based on your needs:
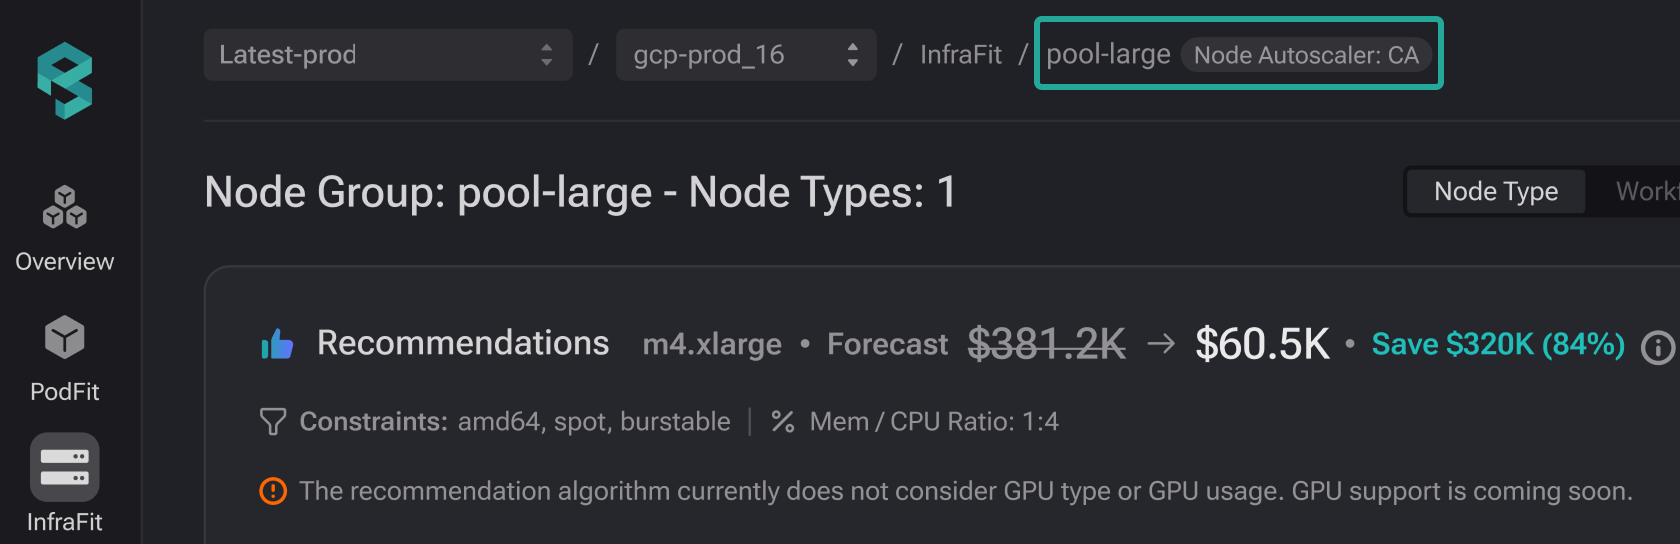
PerfectScale automatically detects if a cluster autoscaler, for example, Karpenter, is running within a specific node group. When detected, a corresponding label is displayed next to the node group name in the top panel:
- Karpenter
- ClusterAutoscaler
- Unknown
⚡️ Node recommendations
Node recommendations are not available when Karpenter is installed in the cluster.
💡 If the current setup is cost-optimal, PerfectScale will not display recommendations, as the environment is considered well-balanced. In this case, a No new recommendations available banner will be shown. However, you can still access node recommendations by clicking Compare All.
Node recommendations
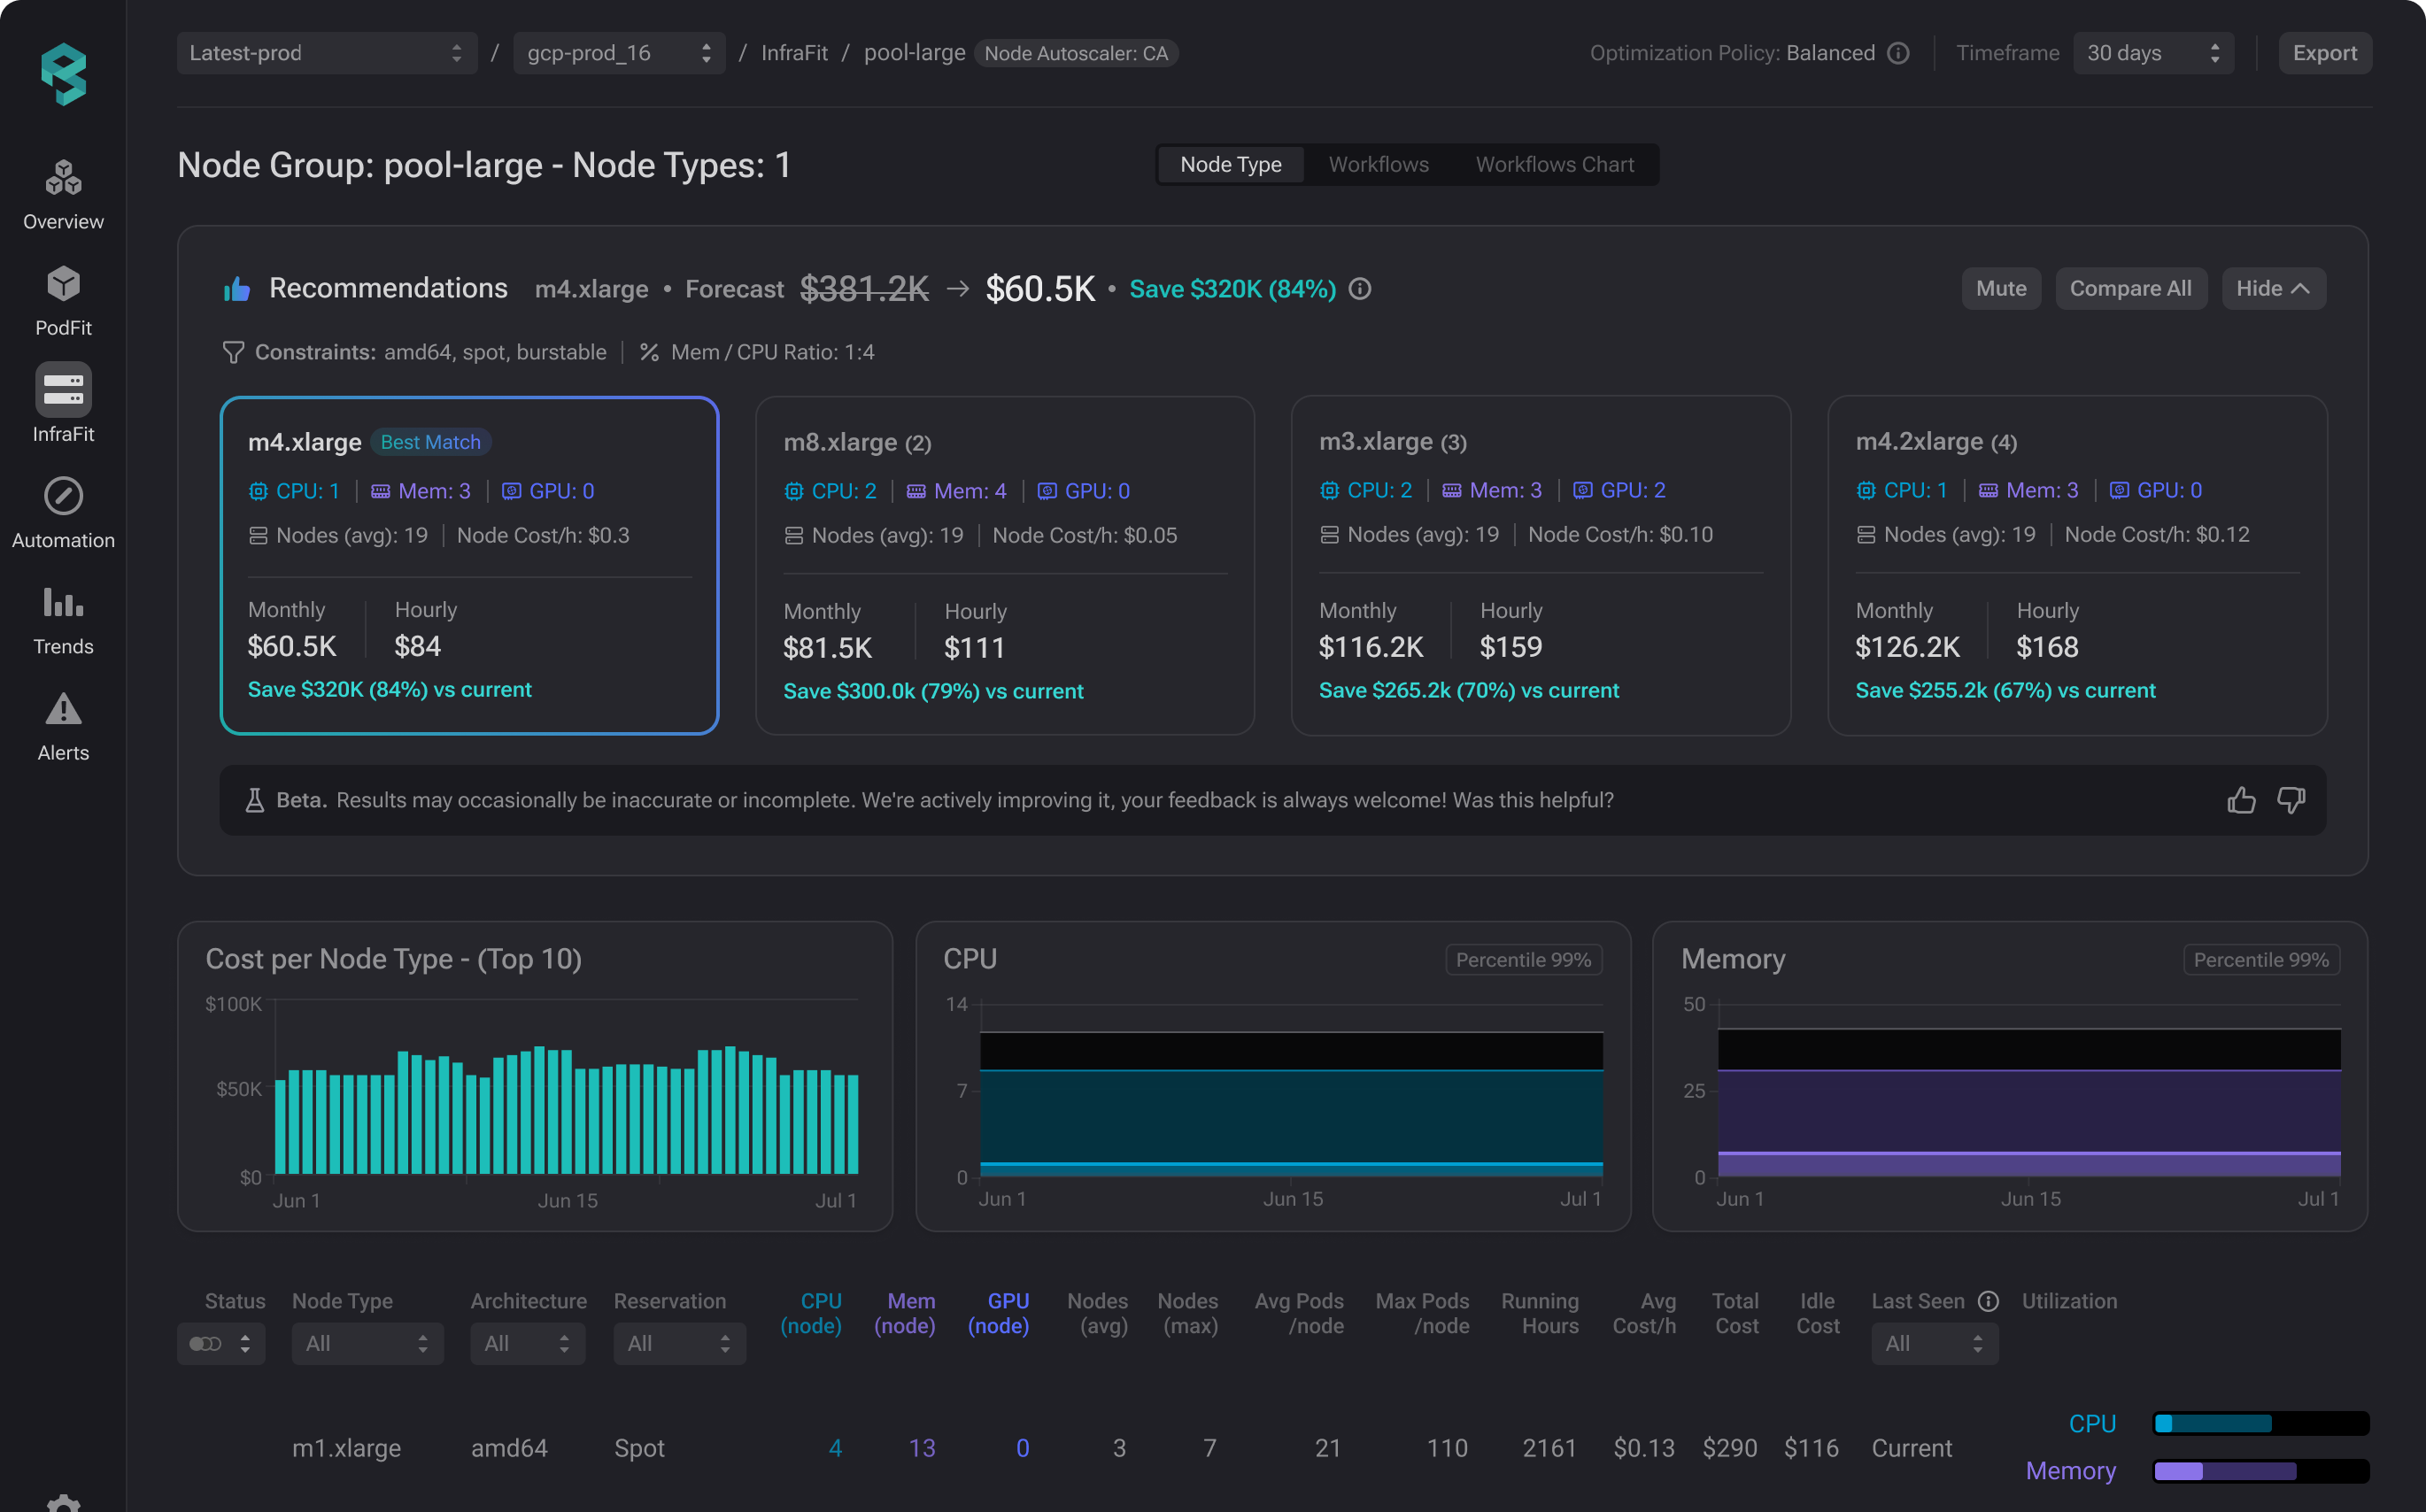
Node Recommendations is a powerful feature that provides actionable, data-driven insights to help you choose the optimal node type for your workloads and streamline the overall optimization process. Also, this view delivers the estimated savings you can achieve by applying the recommendations, enabling better forecasting and budget planning.
PerfectScale continuously analyzes your node groups and recommends alternative instance types that can run the same workloads at a lower cost. It takes into account workload resource requests, DaemonSet overhead, scheduling constraints, and instance compatibility to ensure accurate and reliable recommendations.
Node recommendations are optimized for steady-state workloads (e.g., Deployments, StatefulSets). Bursty workloads like Jobs or CI pipelines may yield less accurate results due to their ephemeral nature.
Click the Show button to expand the view and see the top four best-fit node type recommendations, ranked by achievable savings, with the best match listed first.
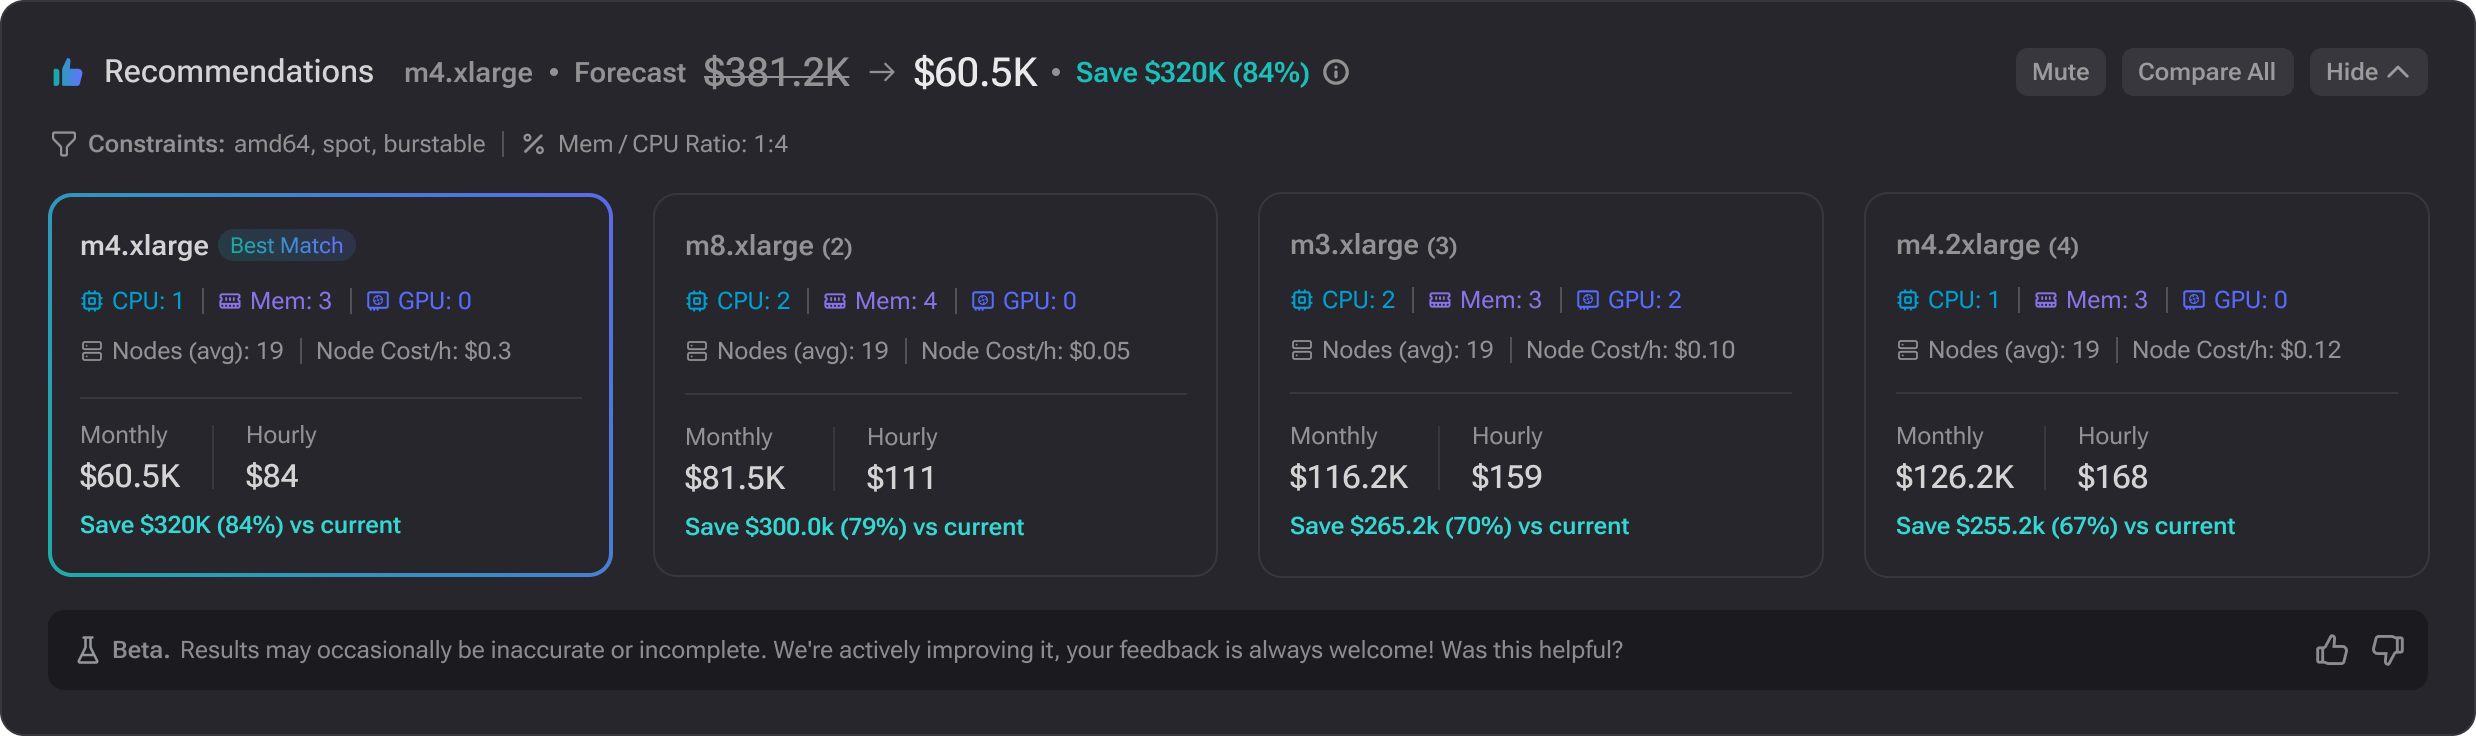
Top ranked node recommendations
Understanding recommendations
PerfectScale provides tailored node recommendations to help you optimize costs while ensuring your workloads run efficiently. The following outlines how these recommendations are calculated:
- Only instance types from compatible families are considered (for example, general-purpose remains within general-purpose, etc.).
- Each instance takes into account the largest single workload, including DaemonSet overhead.
- PerfectScale simulates scheduling before providing the recommendation, ensuring all workloads can be successfully placed on the recommended number of nodes.
GPU-aware recommendations are not currently supported. If a GPU workload is detected, a disclaimer will be displayed to indicate this limitation.

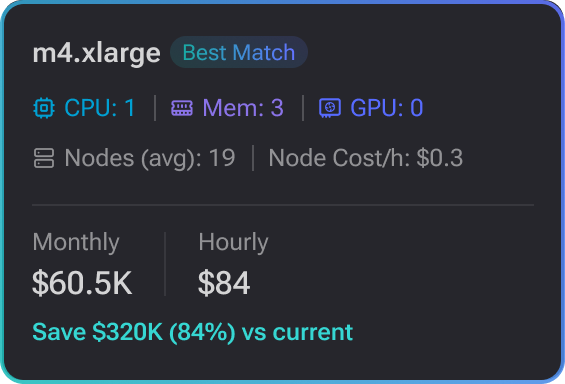
Node recommendation - best match
The recommendations widget provides a recommended node type as well as node details, including instance type, resource allocation, average number of nodes, and the listed hourly node cost.
PerfectScale also displays the projected cost impact, both hourly and monthly, after implementing the recommendations, along with the percentage difference compared to current costs. These values are calculated over a 30-day period using list pricing.
The price comparison between the original and recommended nodes is performed on a like-for-like basis: on-demand to on-demand and spot to spot. PerfectScale does not factor in any discounts the customer currently has on their existing nodes, as we cannot predict what discounts will apply to the recommended nodes if the change is made.
PerfectScale highly values your feedback on node recommendations — don’t forget to click the "Is this helpful?" button to let us know!
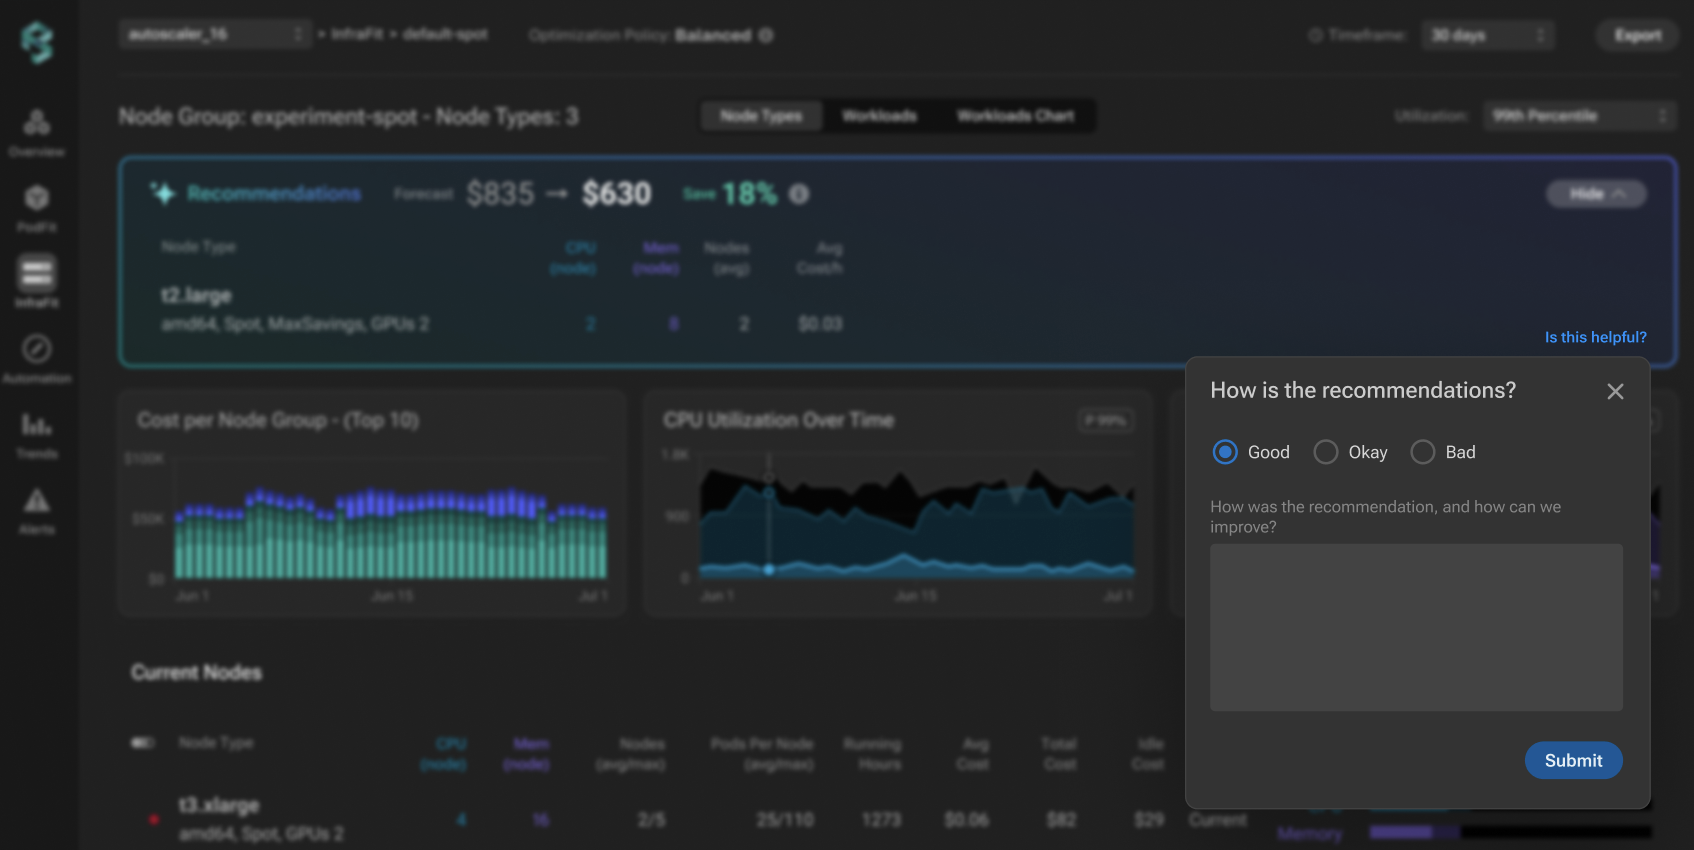
Feedback button
Accessing the full recommendations list
To view all available node recommendations, click the Compare All button. This will open the complete list, which you can search by instance family or type and sort by potential savings, projected cost, and other criteria to quickly find the nodes that best fit your needs.
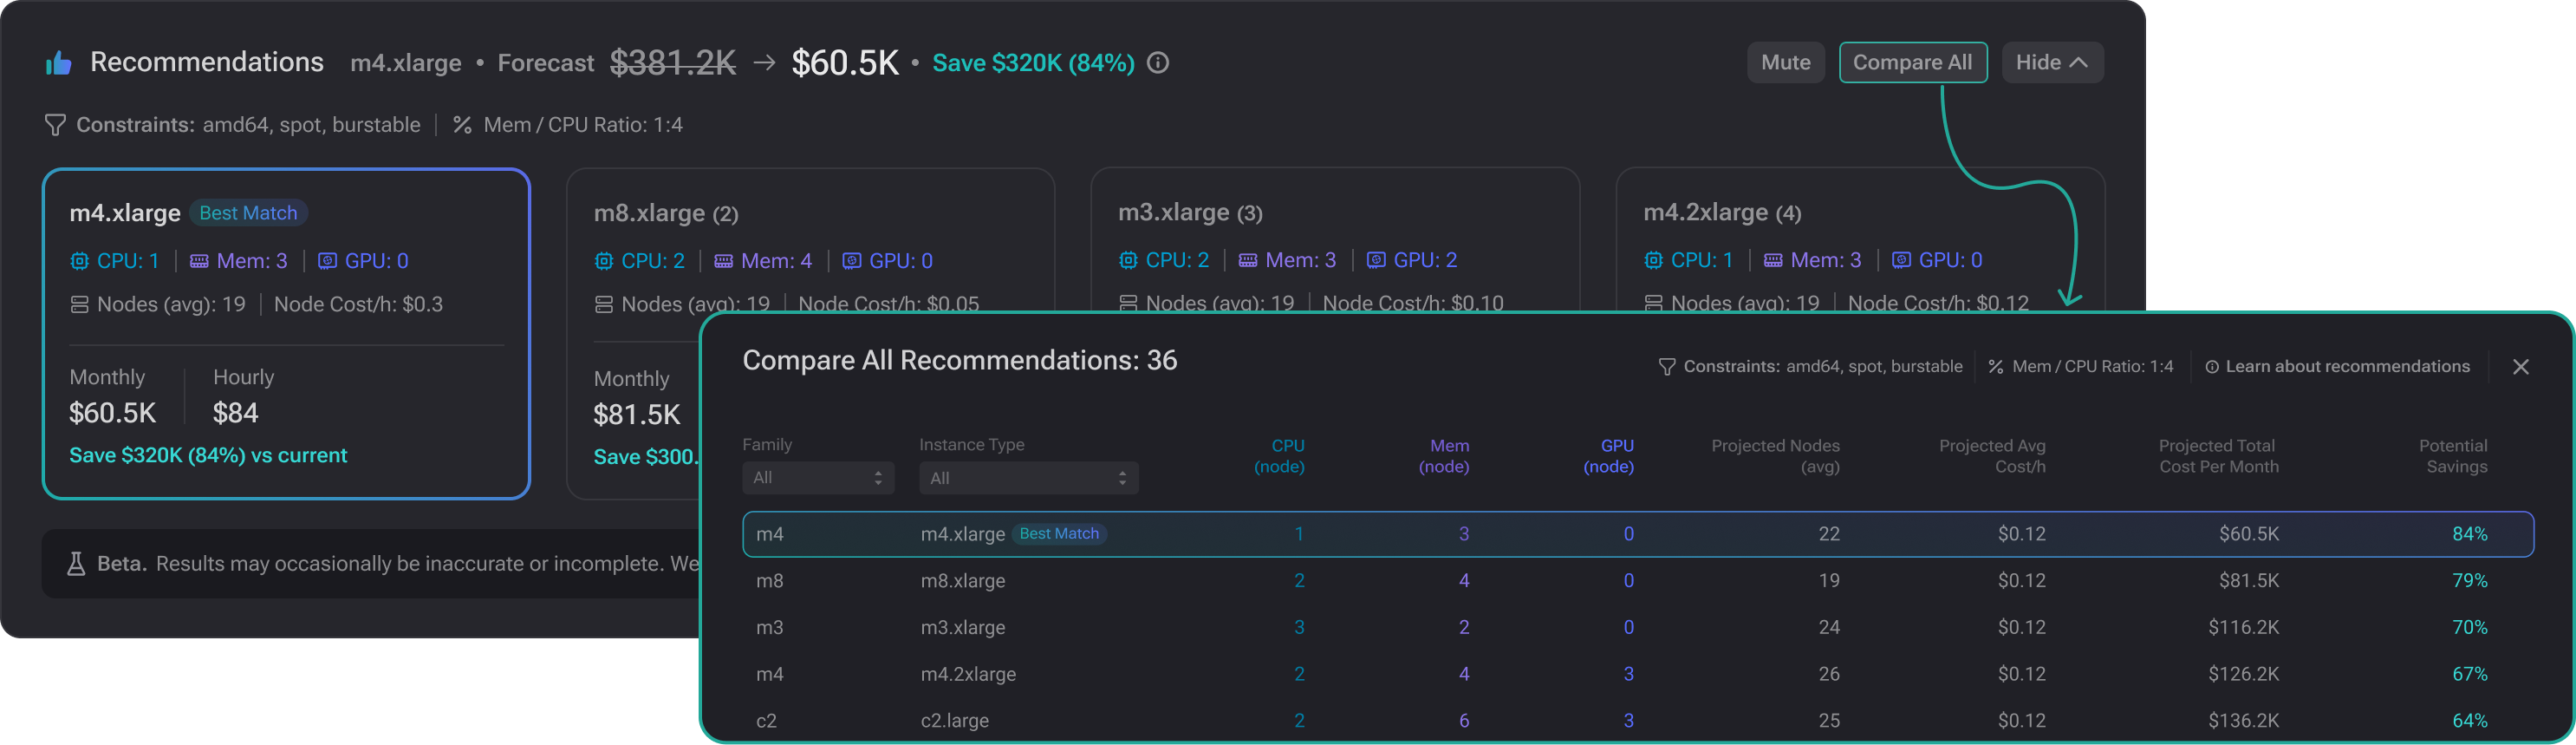
Compare all recommendations
Muting the recommendations
To hide recommendations for a specific node group, click the Mute button for that node group. PerfectScale will stop displaying recommendations for it. You can restore them at any time by clicking Unmute.

Mute recommendations
Node group details
Upper panel
Node Group indicates the name of the node group associated with the displayed data.
Optimization Policy indicates the cluster policy that specifies how your resources should be allocated to support the individual needs of your workloads. Learn more about policies here.
Timeframe allows you to check the data for a specific time period: click on the drop-down list in the upper right corner and select one of the existing options.
Seamlessly Export and effortlessly share your data by exporting it into a .csv file for further analysis.
Node Group Resources Utilization
To view data at a specific percentile, use the Utilization filter. The filter will impact both the charts and the table.
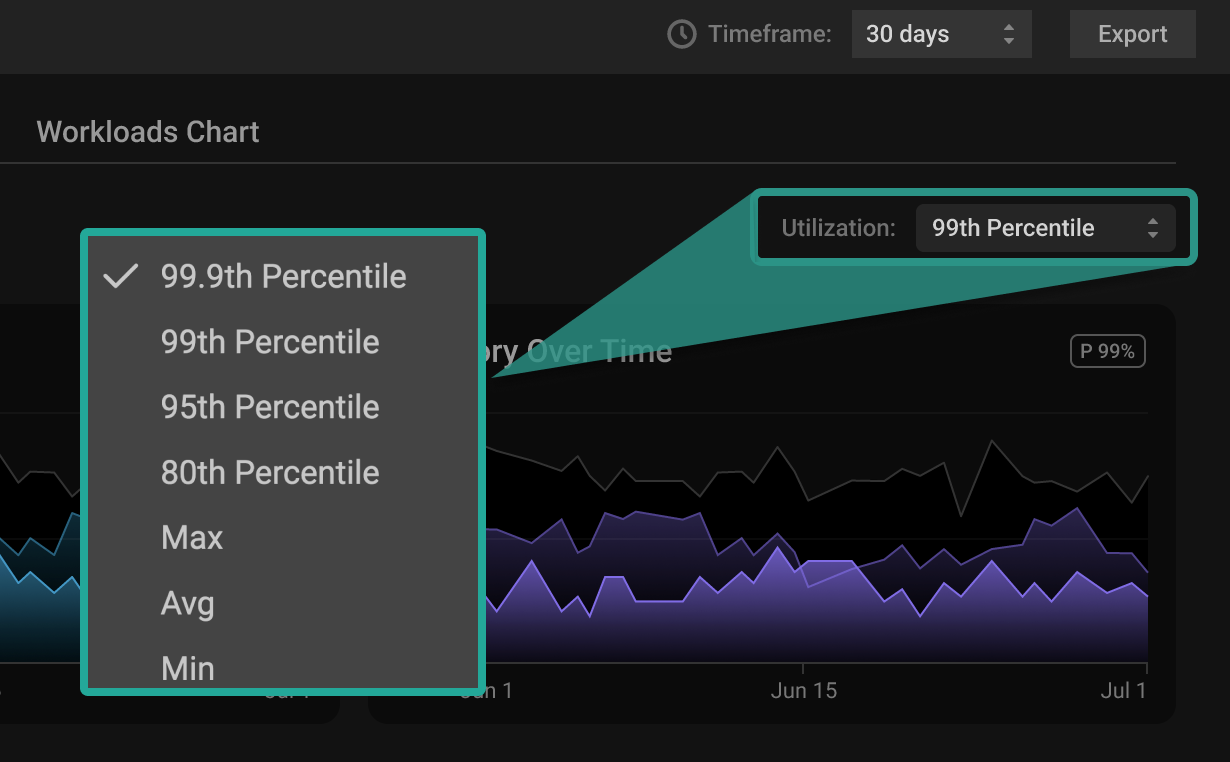
Percentile
Charts
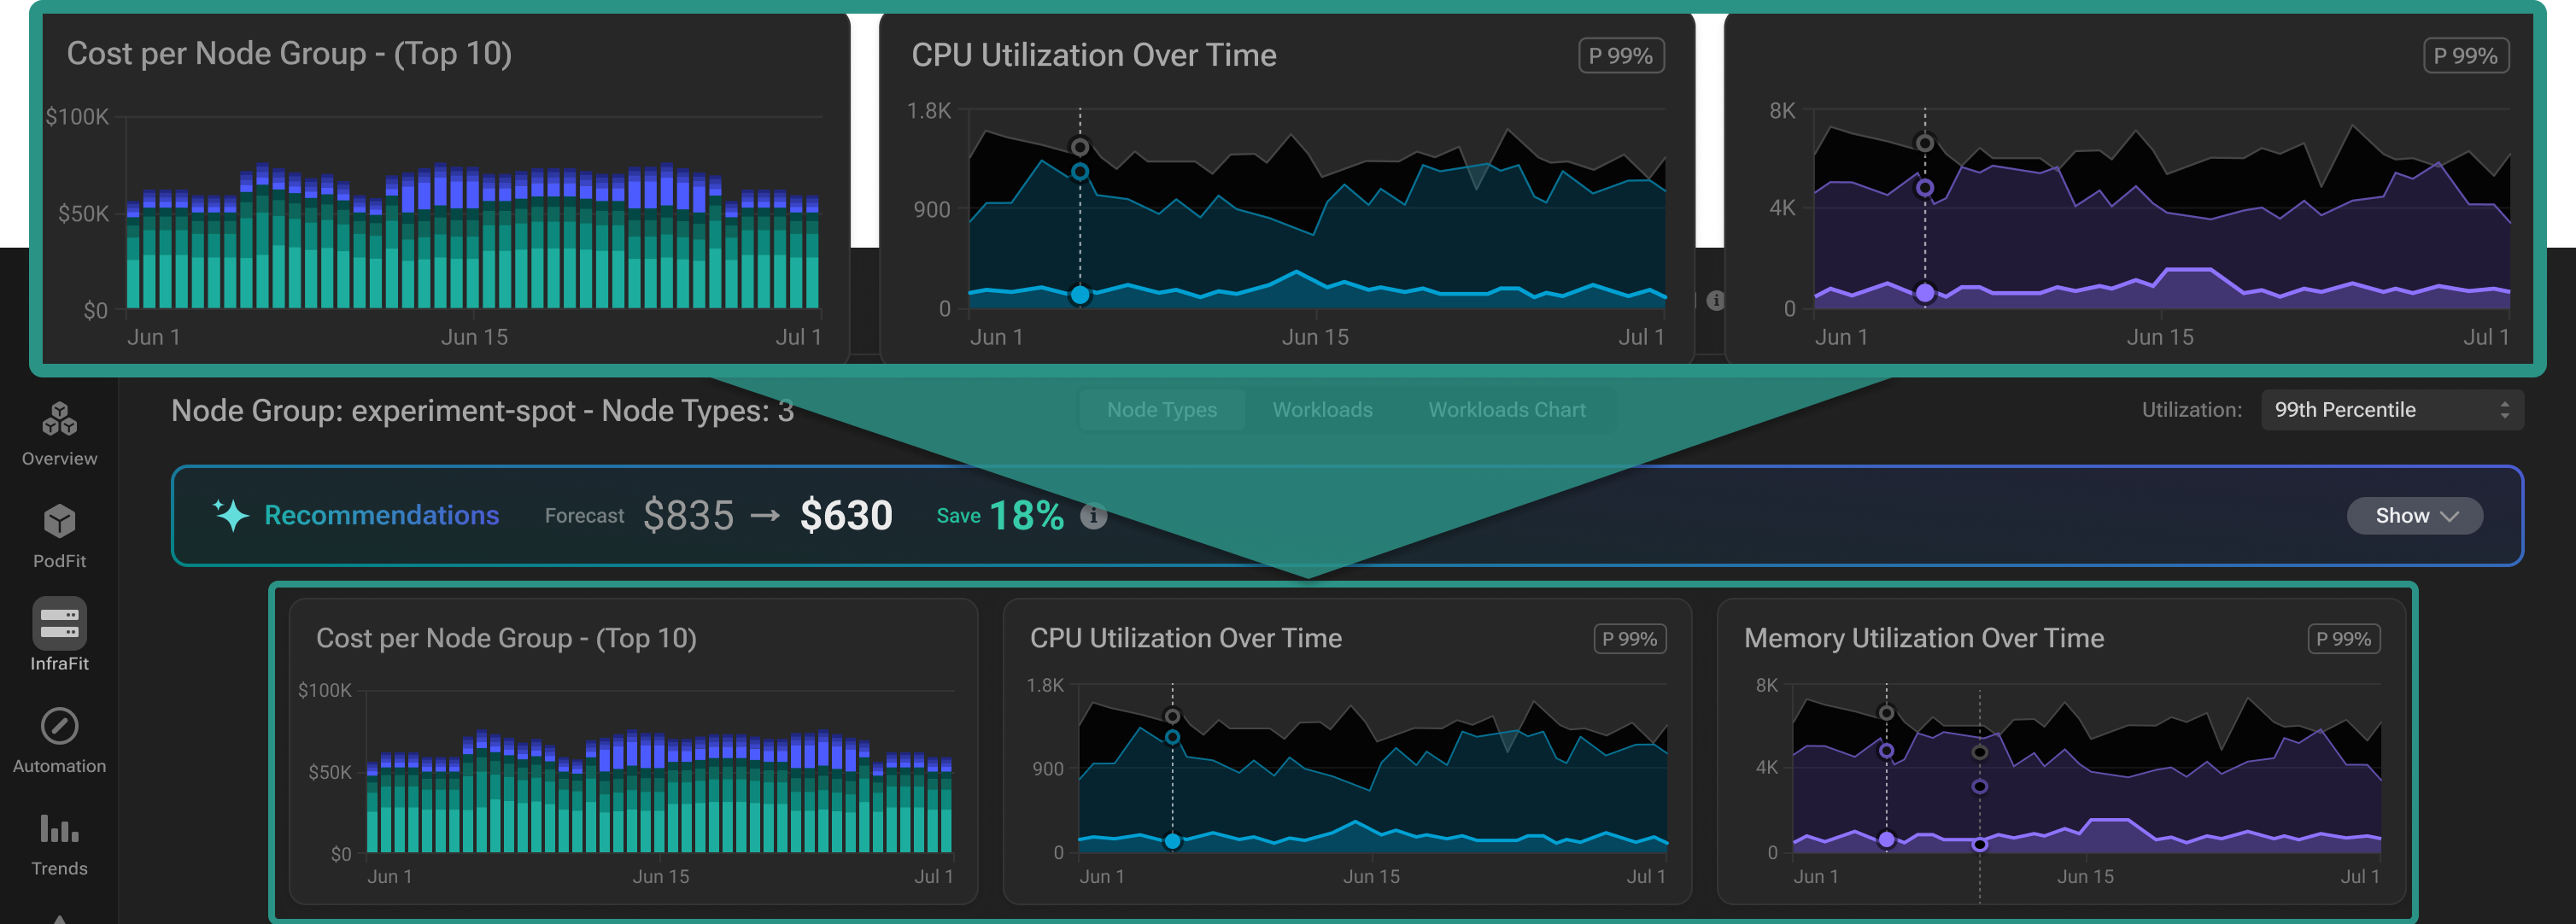
Charts
Cost per Node Type displays the cost trend of the Node Types over the selected timeframe.
CPU displays the allocated, requested, and used amount of CPU (cores) with the selected usage percentile in the group over time.
Memory displays the allocated, requested, and used amount of Memory (GB) with the selected usage percentile in the group over time.
GPU and GPU Memory Over Time
When PerfectScale detects active GPU resources within a cluster, it automatically enables GPU and GPU memory widgets and utilization insights in the UI. Learn more about GPU resources optimization here.
Node group data table
| Column | Description |
|---|---|
| Node Type | Instance Type Name. Click on a column title or use a drop-down list to sort or filter data. |
| Architecture | Node Architecture. Click on a column title or use a drop-down list to sort or filter data. |
| Reservation | Node reservation type. Click on a column title or use a drop-down list to sort or filter data. |
| CPU/Mem (node) | Node size. Click on a column title to sort data. |
| Nodes avg/max | Average and maximum number of nodes with a specific type. Click on a column title to sort data. |
| Avg Pods per Node | Current average number of pods per the node in the node group. |
| Max Pods per Node | The maximum possible pods that can be scheduled on the node. |
| Running Hours | Total instance running hours. |
| Avg Cost/h | Average cost per hour of the instance with the specific type. Click on a column title to sort data. |
| Total Cost | Total cost of nodes with the specific type. Click on a column title to sort data. |
| Idle Cost | Cost of the space in nodes with the specific types that has never been used. Click on a column title to sort the data. |
| Last Seen | Last time PerfectScale observed node with a specific type. |
| Utilization | CPU, Memory, GPU, and GPU memory Utilization (allocation, request, and usage) based on the selected usage percentile. Use a drop-down list to filter data with the needed value. |
Clicking on a specific node type will navigate you to the workloads table, displaying the workloads associated with that node type.
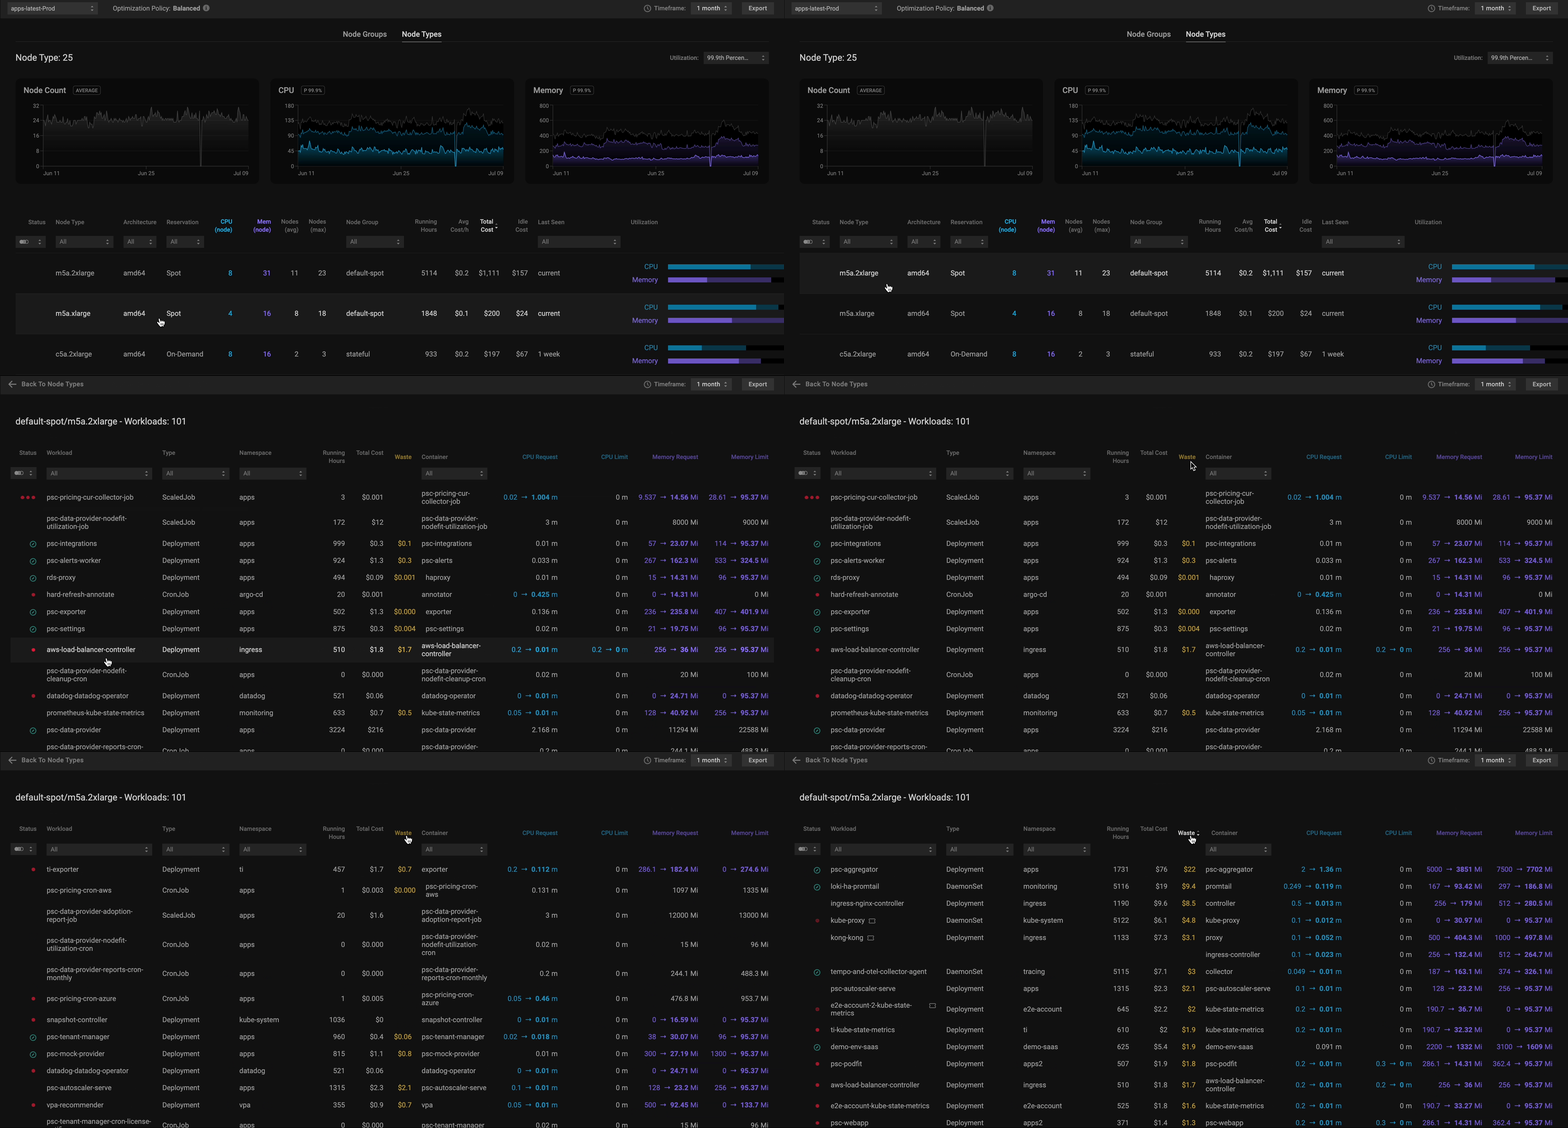
This view is particularly helpful for identifying the most wasteful workload running on the node with the selected type and providing data-driven recommendations on how to eliminate it in a few clicks.
To explore the workload details at a deeper level, click on the specific workload to open a Zoom-in window that provides an in-depth view.
Workloads view
Diving into the workloads running on a specific node enables you to seamlessly identify which workloads contribute the most to resource waste due to over-provisioning and adjust resource allocations with data-driven recommendations, creating new opportunities to optimize your underlying Kubernetes infrastructure.
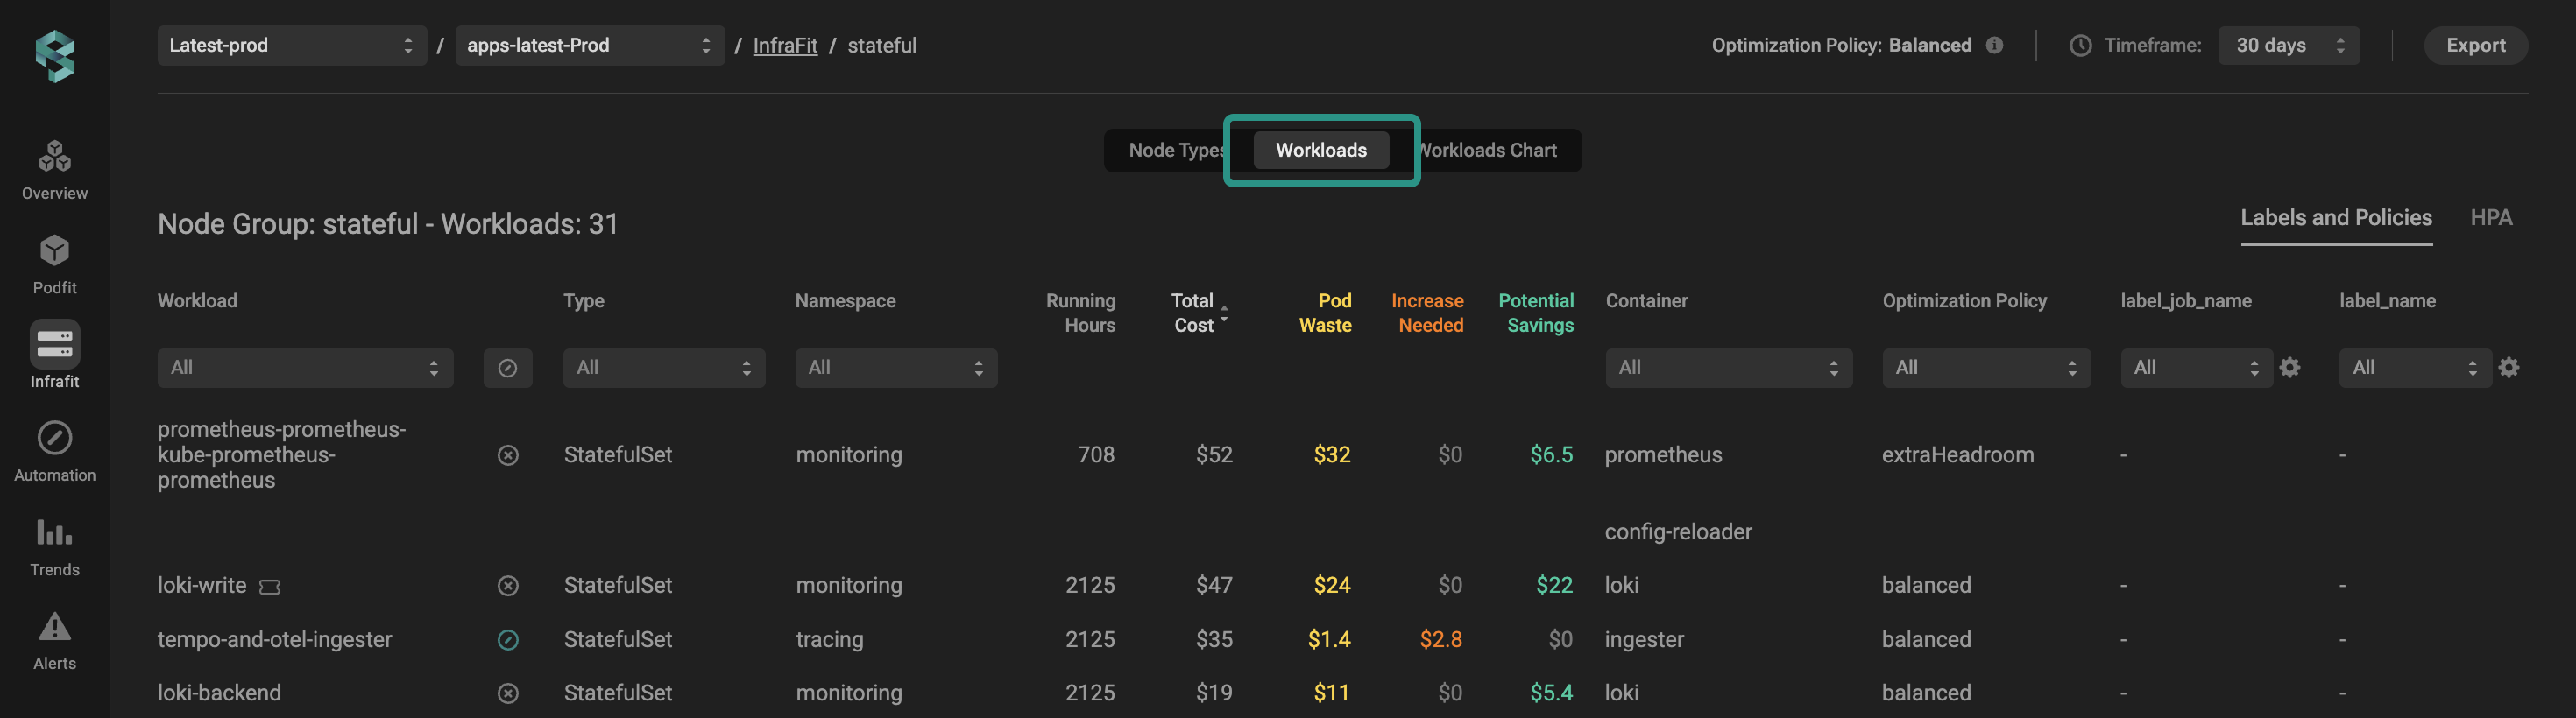
Workloads view
| Column | Description |
|---|---|
| Workload | Indicates the name of the workload. |
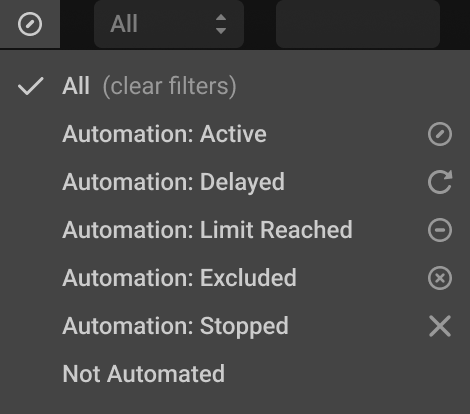
| Automation | Displays the automation status of a particular workload. You can easily sort the data by automation status to focus on the most relevant information for further investigation.
|
| Type | Indicates the type of the workload. |
| Namespace | Indicates the workloads' namespace. |
| Running Hours | The workload running hours. |
| Total Cost | The total cost of allocated resources of the workload. |
| Pod Waste | The total cost of reducible workload resources. |
| Increase Needed | An estimated cost increase associated with implementing the recommendation to resolve resiliency risks caused by underprovisioned resources. |
| Potential Savings | An estimated dollar savings by applying workload sizing recommendations. |
| Container | Indicates the container of the workload. |
Labels and Policies view
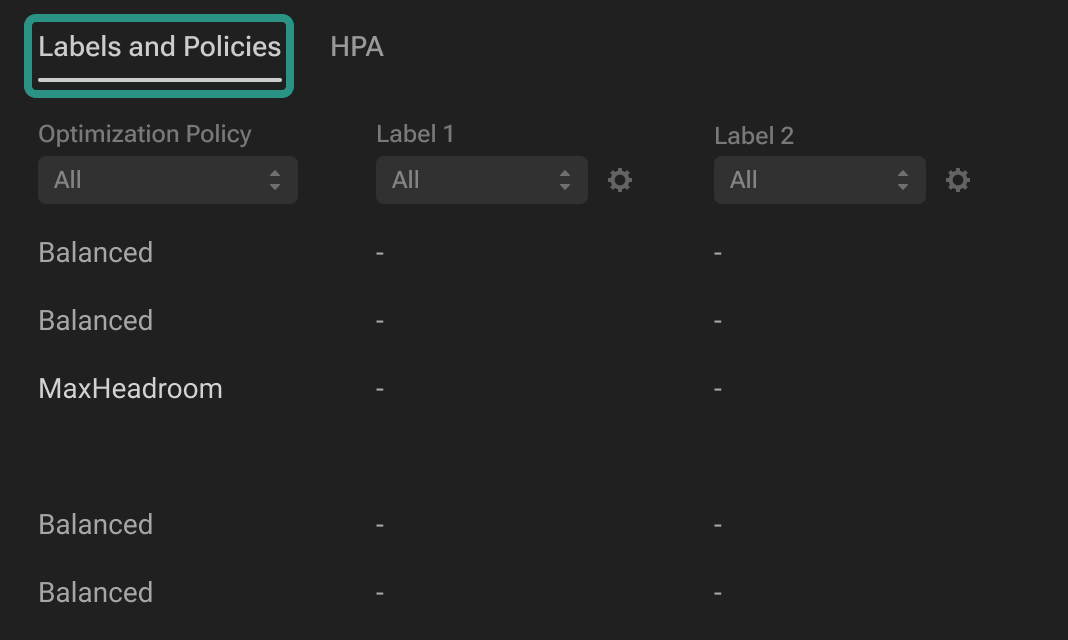
Labels and policies view
| Column | Description |
|---|---|
| Optimization Policy | Displays the Optimization policy associated with the workload:
|
| Labels | Displays the label associated with the workload. You can select up to two labels to display. |
To configure the label, click on the gear button. Then, choose the desired labels to be displayed and click the Apply button. Once the changes are applied, the values corresponding to the selected workload keys will be displayed.
The Workload labels have higher precedence than Namespace labels. If the Workload label and Namespace label have the same name, only the Workload label will display.
HPA view
The HPA view provides a clear overview of workloads utilizing Horizontal Pod Autoscaler (HPA). This feature enables users to quickly identify the workloads where HPA has been introduced and adjust HPA thresholds with provided informative tooltips that offer tailored recommendations. These recommendations are particularly helpful in optimizing scaling decisions, minimizing resource waste, and ensuring efficient operation of workloads.
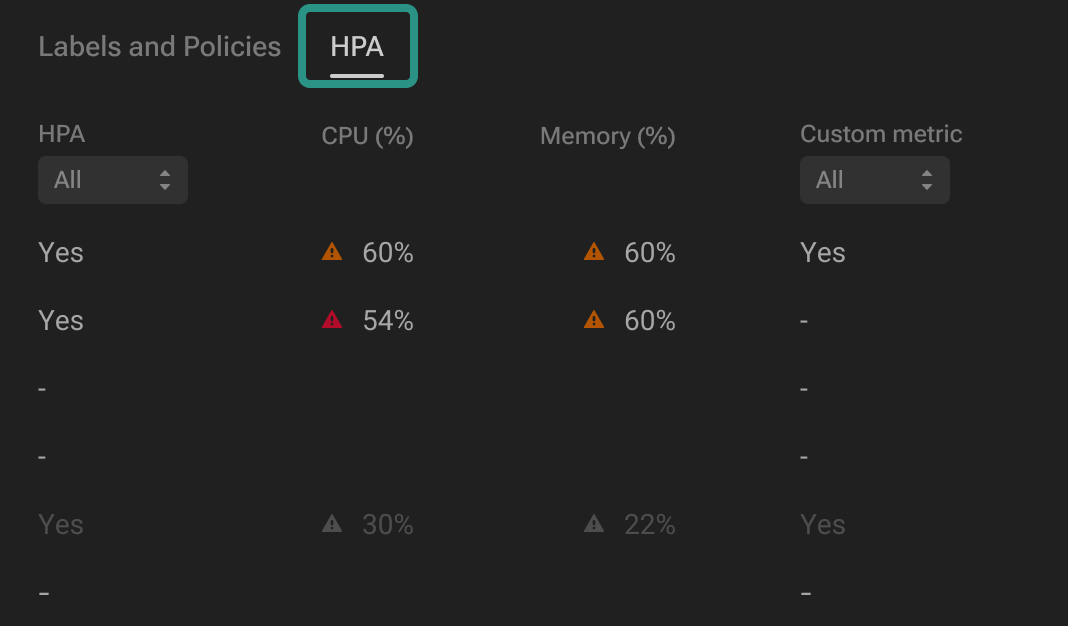
HPA view
| Column | Description |
|---|---|
| HPA | Indicates whether HPA has been introduced for the workload. You can easily sort the column by clicking the header or apply specific filters. |
| CPU (%) | Displays the trigger for HPA by CPU. For insights on threshold recommendations, simply hover over the warning tooltip. You can easily sort the column by its values by clicking the header.
|
| Memory (%) | Displays the trigger for HPA by Memory. For insights on threshold recommendations, simply hover over the warning tooltip. You can easily sort the column by its values by clicking on the header.
|
| Custom metric | Indicates whether a Custom metric has been detected. You can easily sort the column by clicking the header or apply specific filters. |
Workloads chart view
The workloads trend chart helps you identify waste and cost trends within the Node Group, directing your focus to the most critical and valuable aspects.
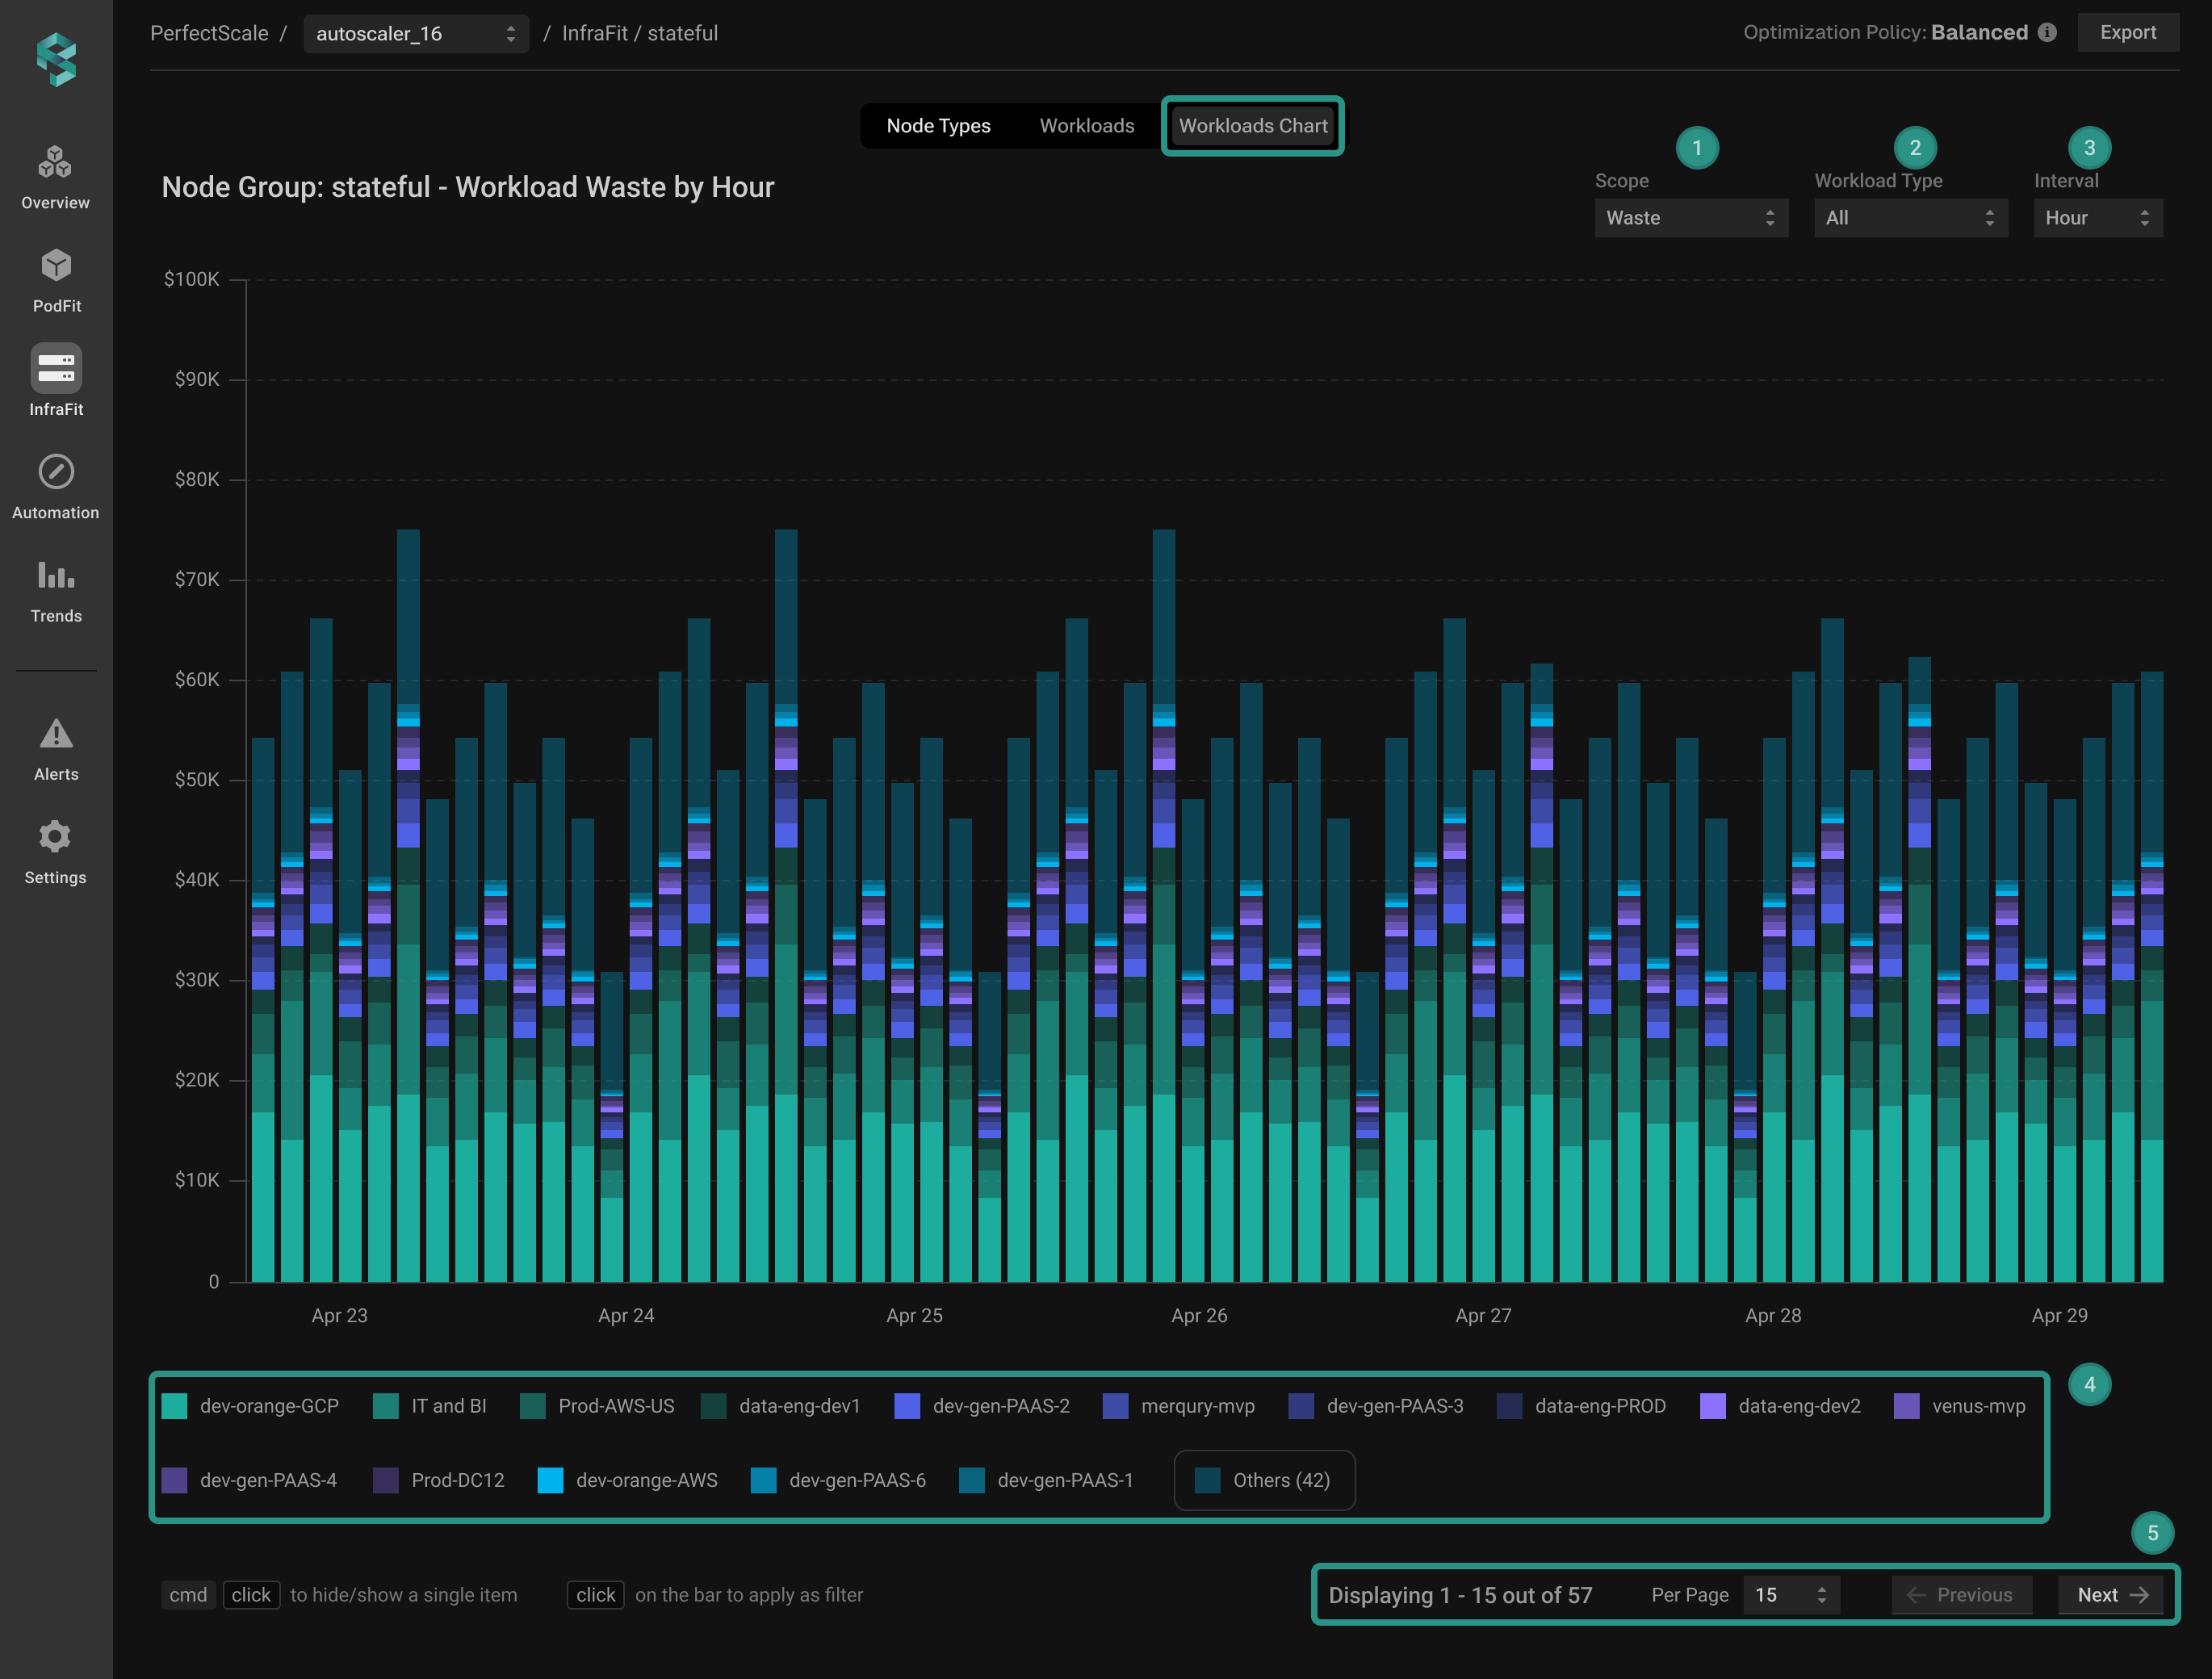
Workloads chart
1. Scope
Select whether you want to display the workload data by waste or cost using this selector.
2. Workload Type
Filter the data by the workload type.
3. Interval
Select the interval for data display based on your desired data granularity.
4. Legend
Use the workloads legend to include or exclude the particular workloads from the chart.
Maximize your productivity by utilizing Shortcuts.
Ctrl/Command+Clicklegend entity = Select/Deselect the entity. Allows to do a multi-select.Clickchart/legend entity = select one or all entities.
5. Limit Selector
Choose a limit from the dropdown (from 1 to 15) to exhibit only the top N entities
The entities not falling within the specified limit will be consolidated to Other on the diagram. To view entities beyond the limit, use the Previous and Next buttons.
Unevictable pods
Unevictable Pods provides you clear visibility into the workloads preventing nodes from being removed from a cluster. In the Unevictable Pods view, you can explore nodes and their pods, quickly identify pods that cannot be evicted, and access the detailed pod and node data for further investigation. By combining a cluster-wide view with node-level detail, it helps you seamlessly identify and address scale-down blockers, improve bin-packing, maximize the efficiency of your cluster autoscaling solution (like Karpenter, or Cluster Autoscaler), and ultimately optimize your K8s cloud costs.
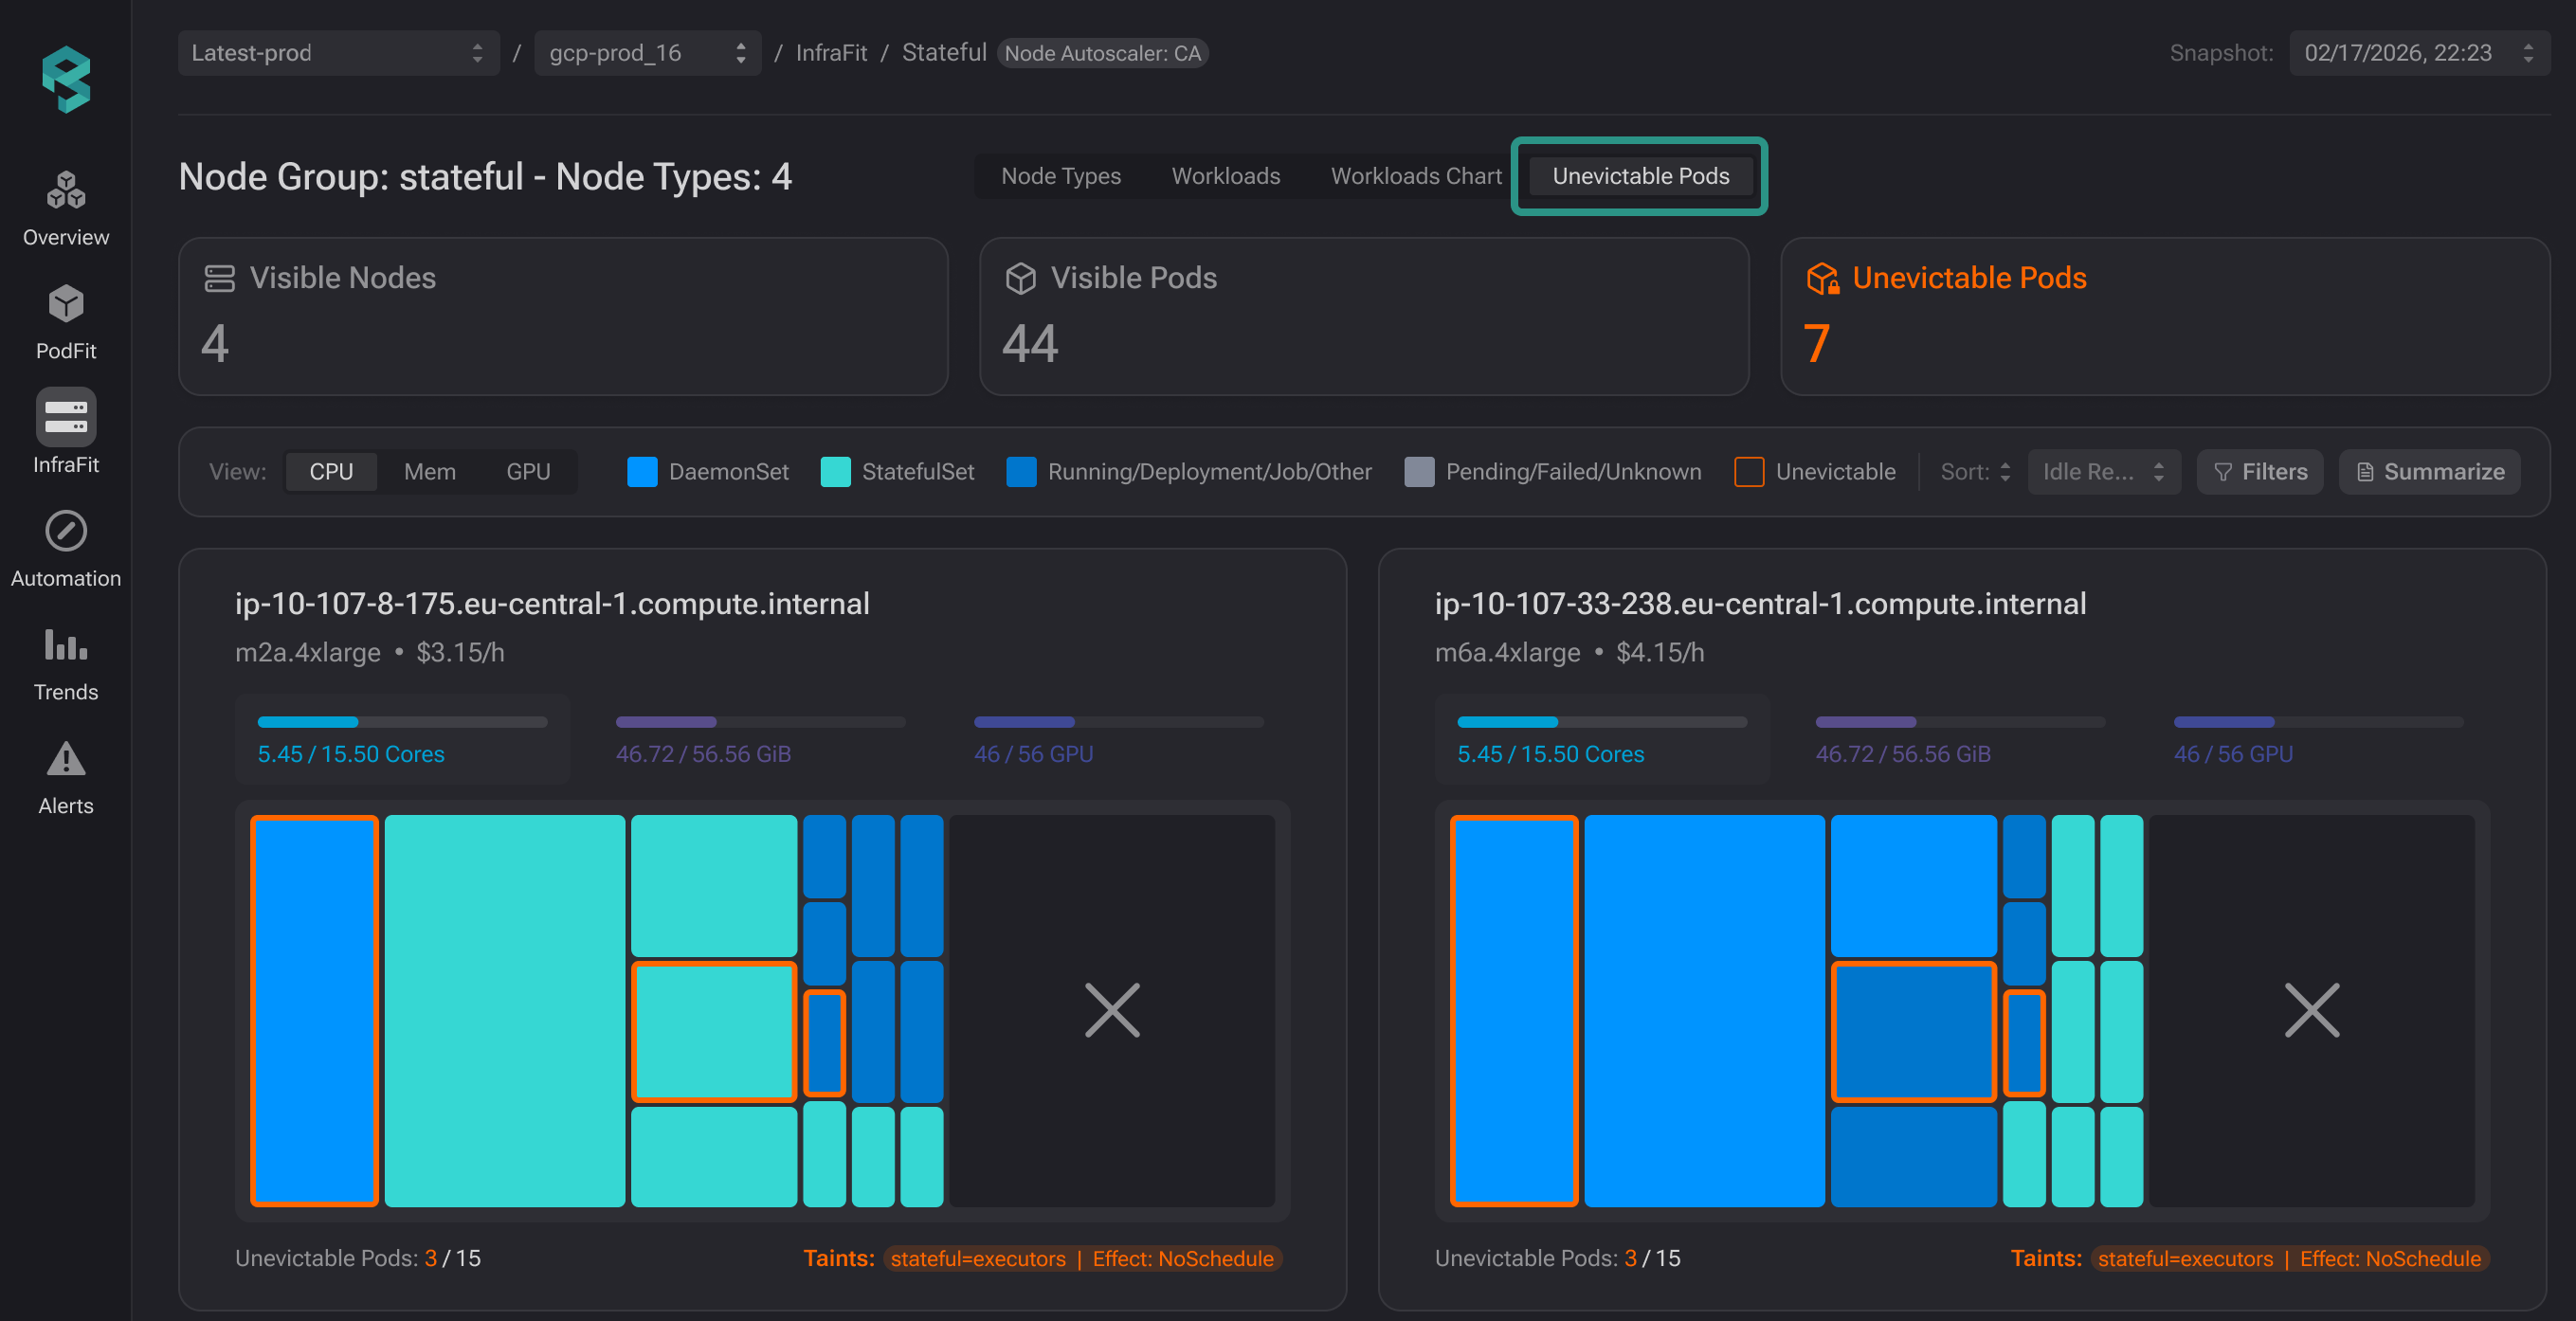
Unevictable pods view
Getting started
In Infrafit, select the desired node group and switch to the Unevictable Pods view. The chart displays all nodes from the currently selected node group, using the latest available snapshot by default.
Snapshot selector
Use the date picker in the top-right corner to select a specific snapshot (up to one month back).
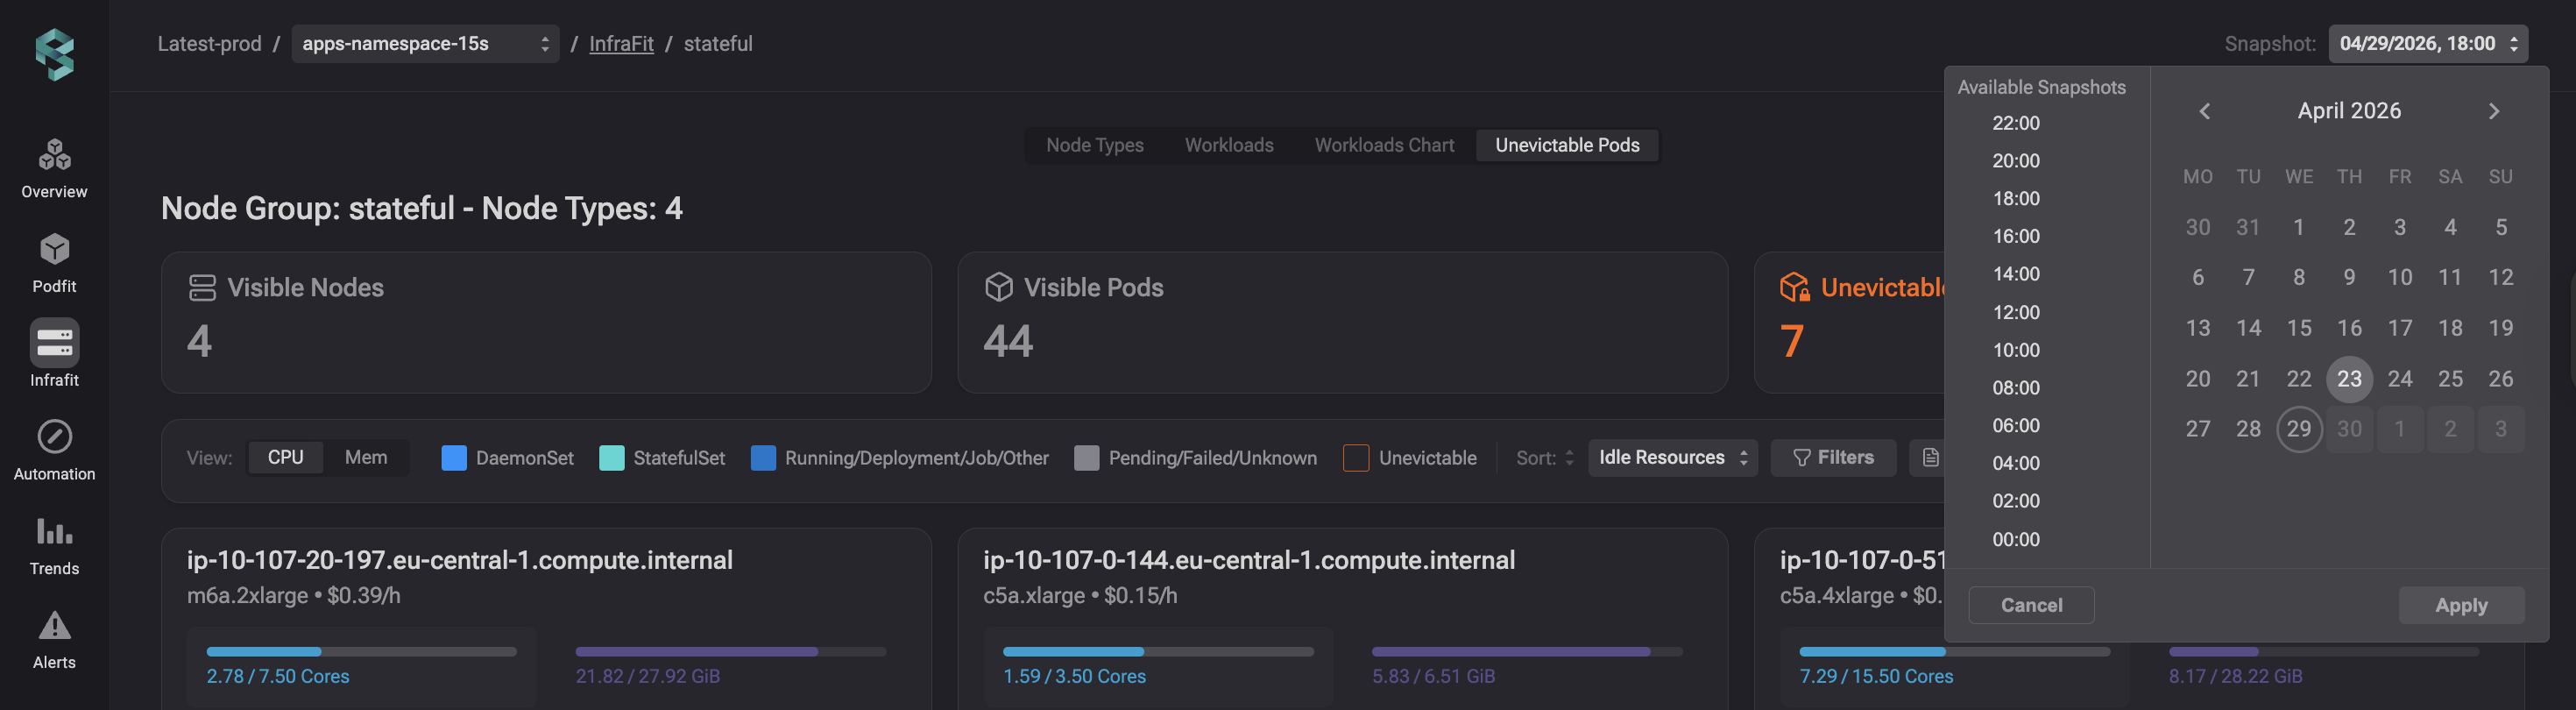
Snapshot
Top panel summary
The top panel shows a summary of the selected node group across node types, including total running pods, as well as the number of unevictable pods. This helps you identify whether unevictable pods are present and could affect scale-down, highlighting savings opportunities.

Unevictable Pods - top panel
Instance charts
Use the Instances charts for deeper analysis. This view shows which pods are running on each instance, their share of resources, and whether any of them are unevictable, helping you quickly understand if pods may impact scale-down.
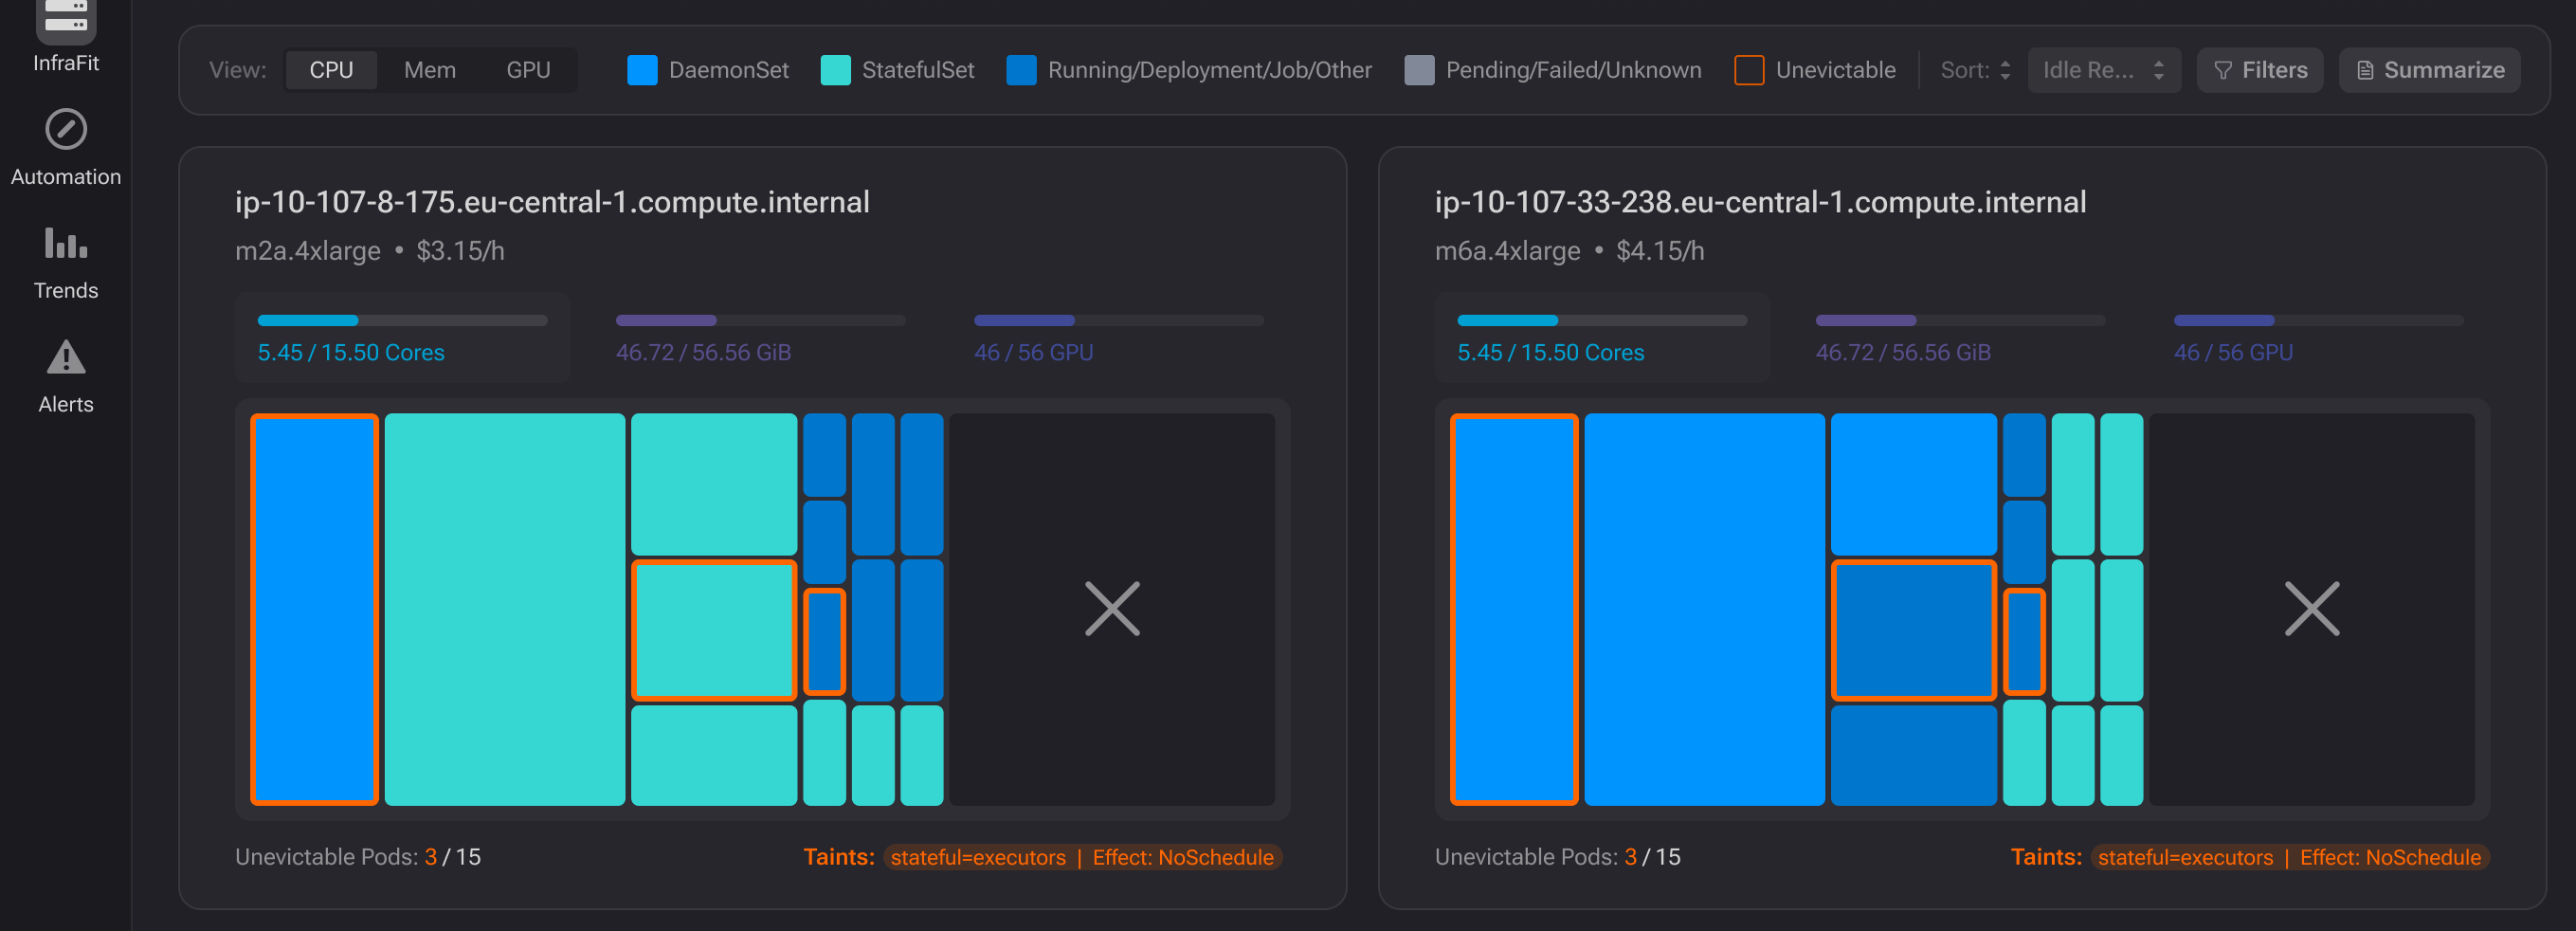
Instances charts
View by resource type
Switch between CPU, Memory, and GPU views using the view selector to display data by a specific resource type.
Node cards
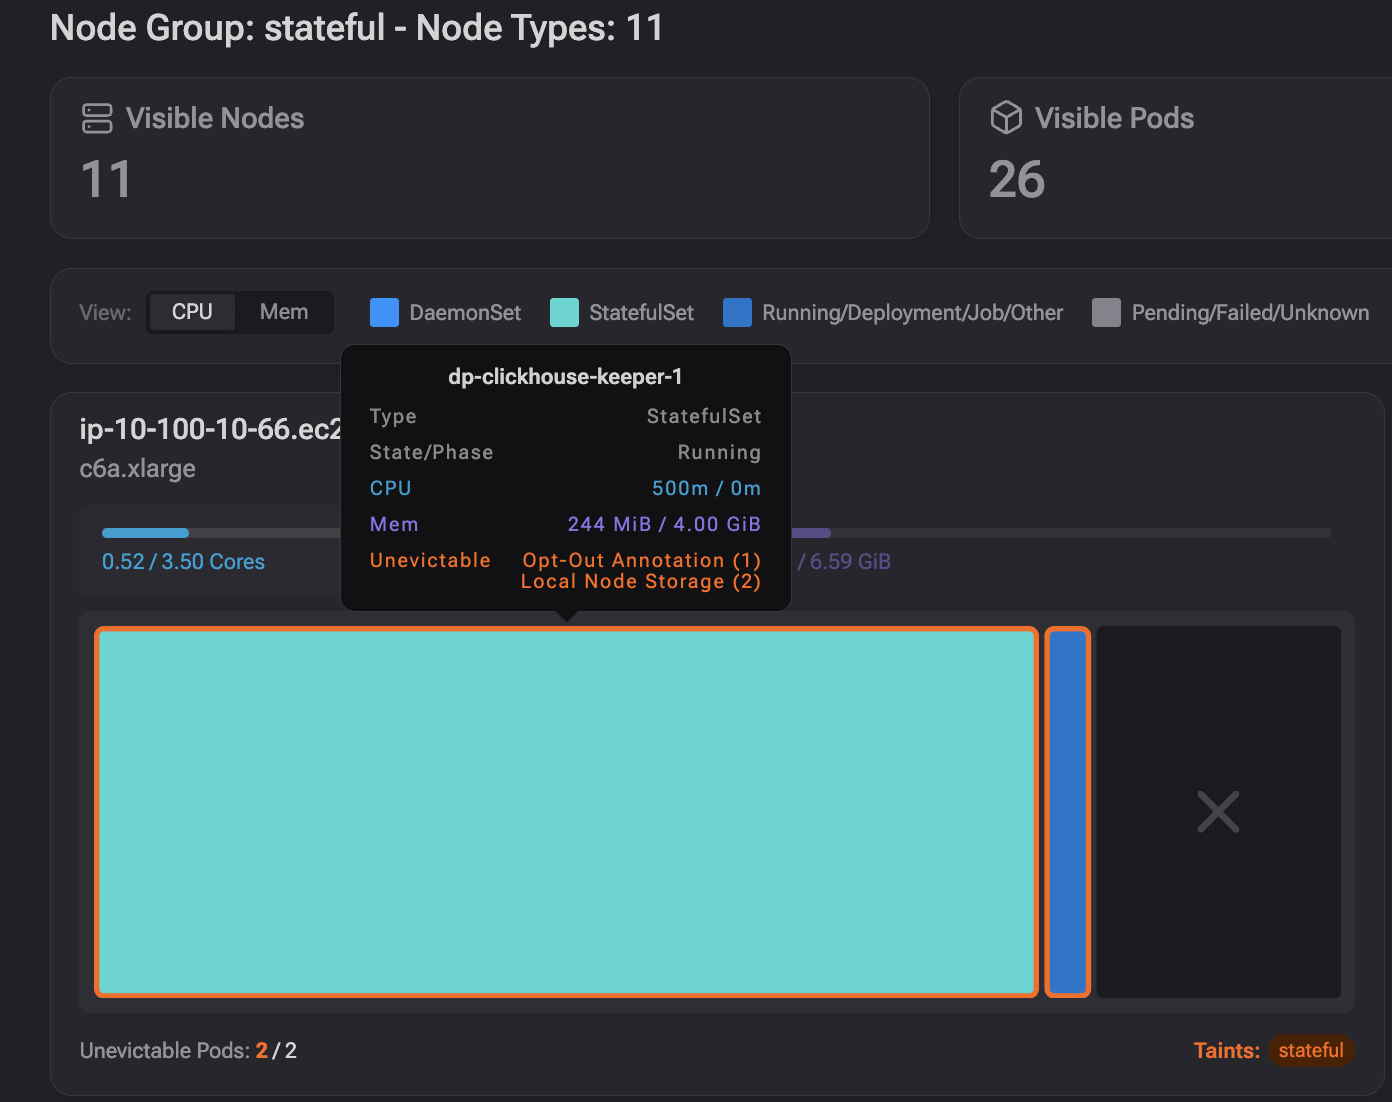
Node cards
Each node is represented as a card displaying the following information:
- Resource bars: Horizontal bars showing requested vs. total capacity for CPU, RAM, and GPU.
- Pod treemap: Pods inside each node are displayed as a treemap. Unevictable pods are highlighted with a red border for quick identification.
- Bottom labels: Each card shows the node's taints and a count of unevictable pods.
By hovering over a pod, you can see its details in the tooltip. However, if you need more extensive view, click on a pod or a specific node, so you can get a full details in the sidebar.
By clicking on any node or pod, you can open the sidebar detail view, which includes:
- Item info — name, namespace, resource requests and limits, and other key metadata
- Resources utilized — a breakdown of actual resource usage
- Labels — all Kubernetes labels applied to the node or pod
- Annotations — all Kubernetes annotations associated with the item
- and more
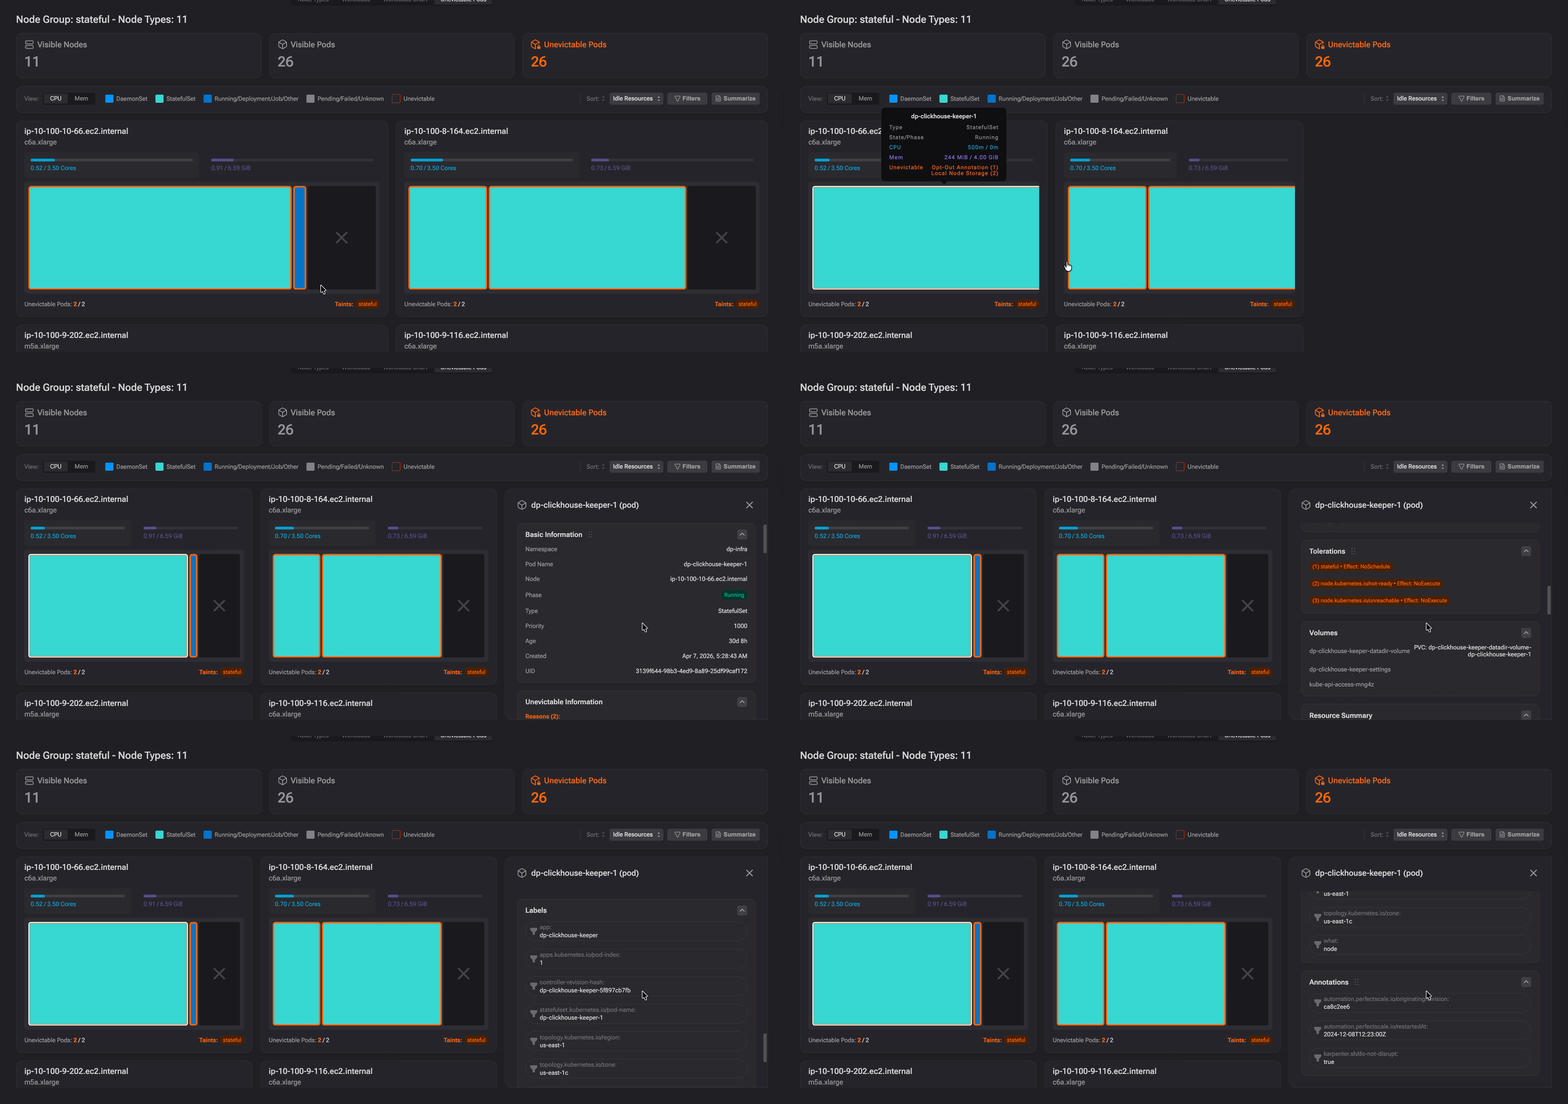
Pod details
Filters and sorting
Use the Filter sidebar to narrow down the view by node-level or pod-level criteria. Filters allow you to focus on specific subsets of your cluster, such as nodes with taints or pods in a particular namespace, etc.
Use the Sort dropdown to reorder nodes based on different criteria, such as idle, resource utilization or unevictable pod count.
⚡️ Unevictable pods recommendations
When PerfectScale detects unevictable pods, it provides precise, data-driven YAML diff recommendations that compare the current configuration with the recommended changes, helping you troubleshoot bin-packing issues and resolve them in just a few clicks.
To access Unevictable Pods recommendations, select the relevant NodeGroup in InfraFit, open the Unevictable Pods view, and click See Recommendations or the Unevictable Pods widget.
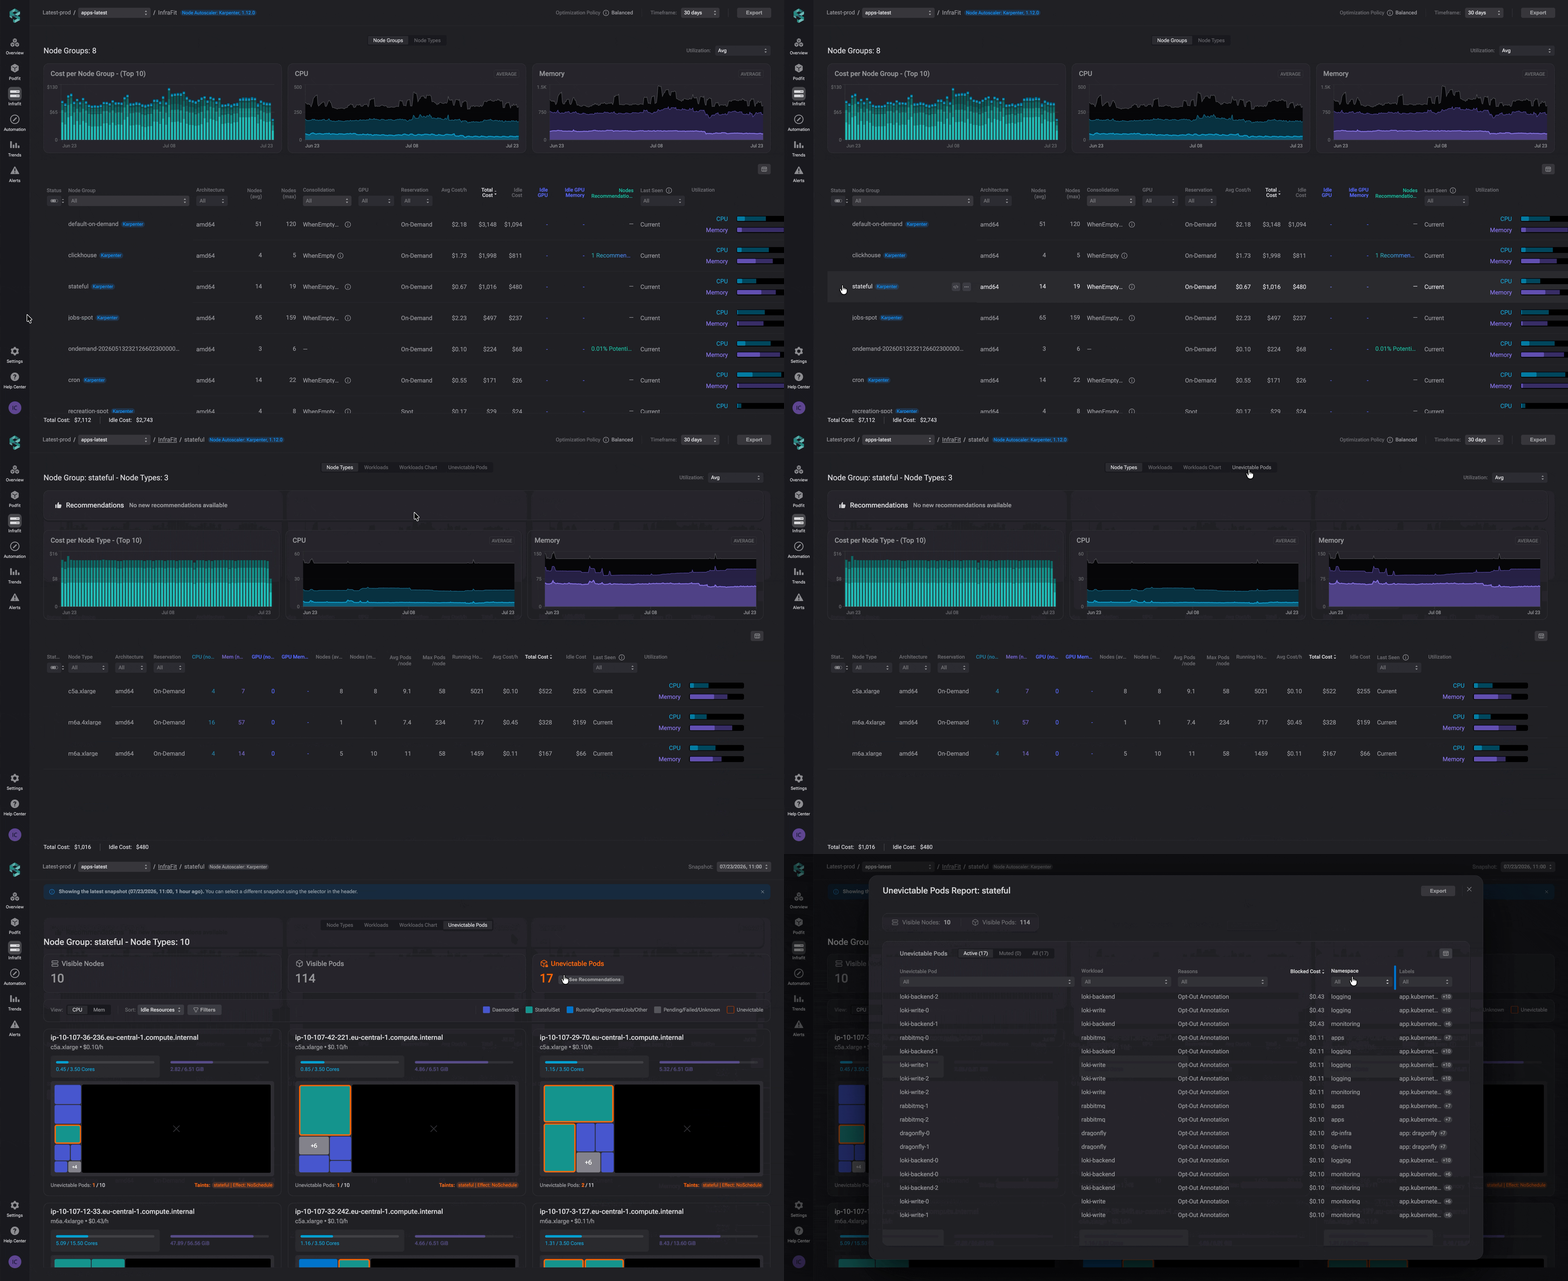
Unevictable pods recommendations
Recommendations are automatically prioritized and ranked by cost impact, helping you focus on the highest-value optimization opportunities first and maximize savings.
Click See Recommendation next to a recommendation to open its details. You'll find a clear explanation of the recommended change, along with the corresponding YAML configuration that you can copy with a single click and apply directly to your manifest.
To help you optimize with confidence, PerfectScale assigns a confidence level and risk level to every recommendation. These indicators help you assess the expected impact of each change, enabling safe optimization while maintaining application reliability and performance.
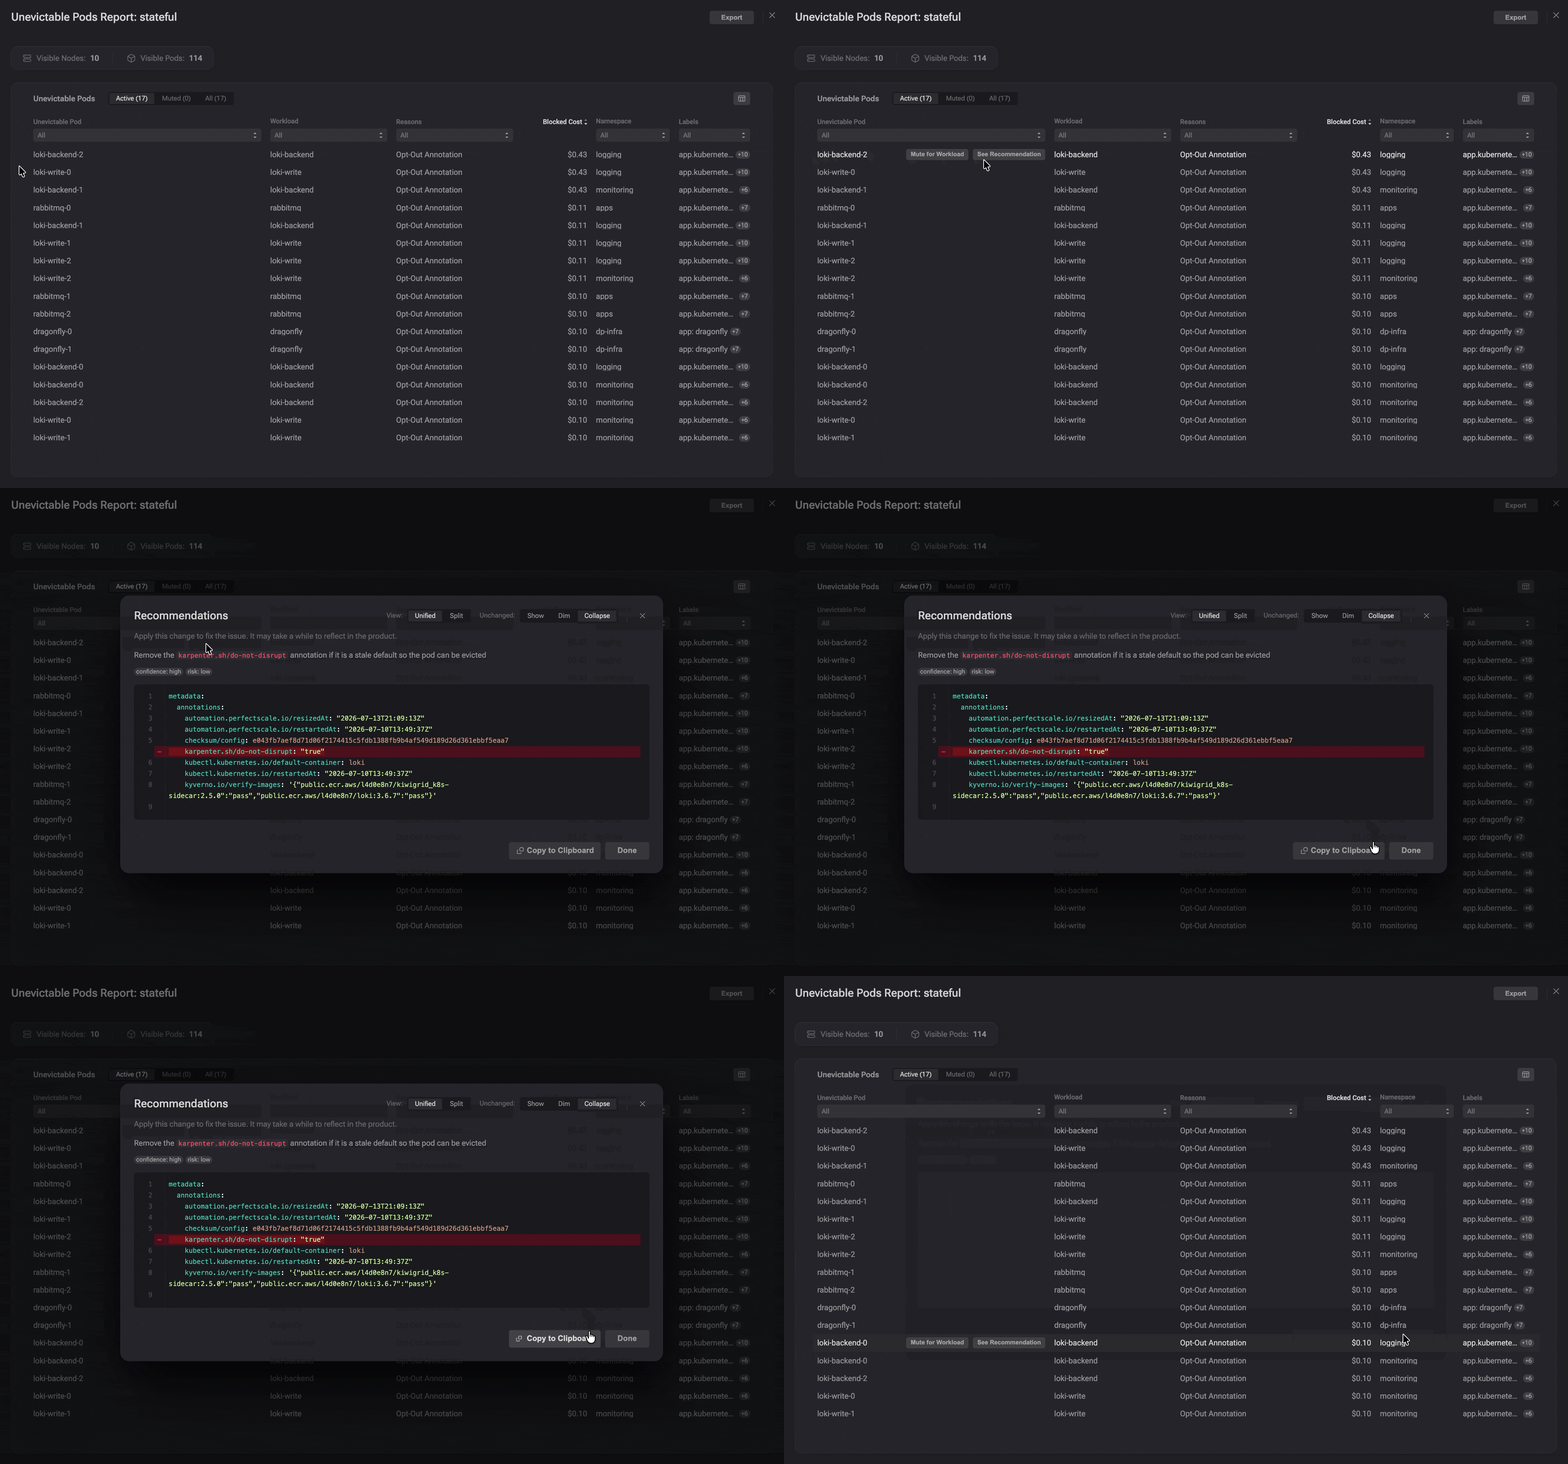
Recommendation YAML
Some findings may be intentional and do not require any action. If that's the case, click Mute for Workload. PerfectScale will automatically hide the same finding for all unevictable pods in that workload, so it won't appear in future scans. You can still view muted findings in the Muted tab and unmute them at any time.
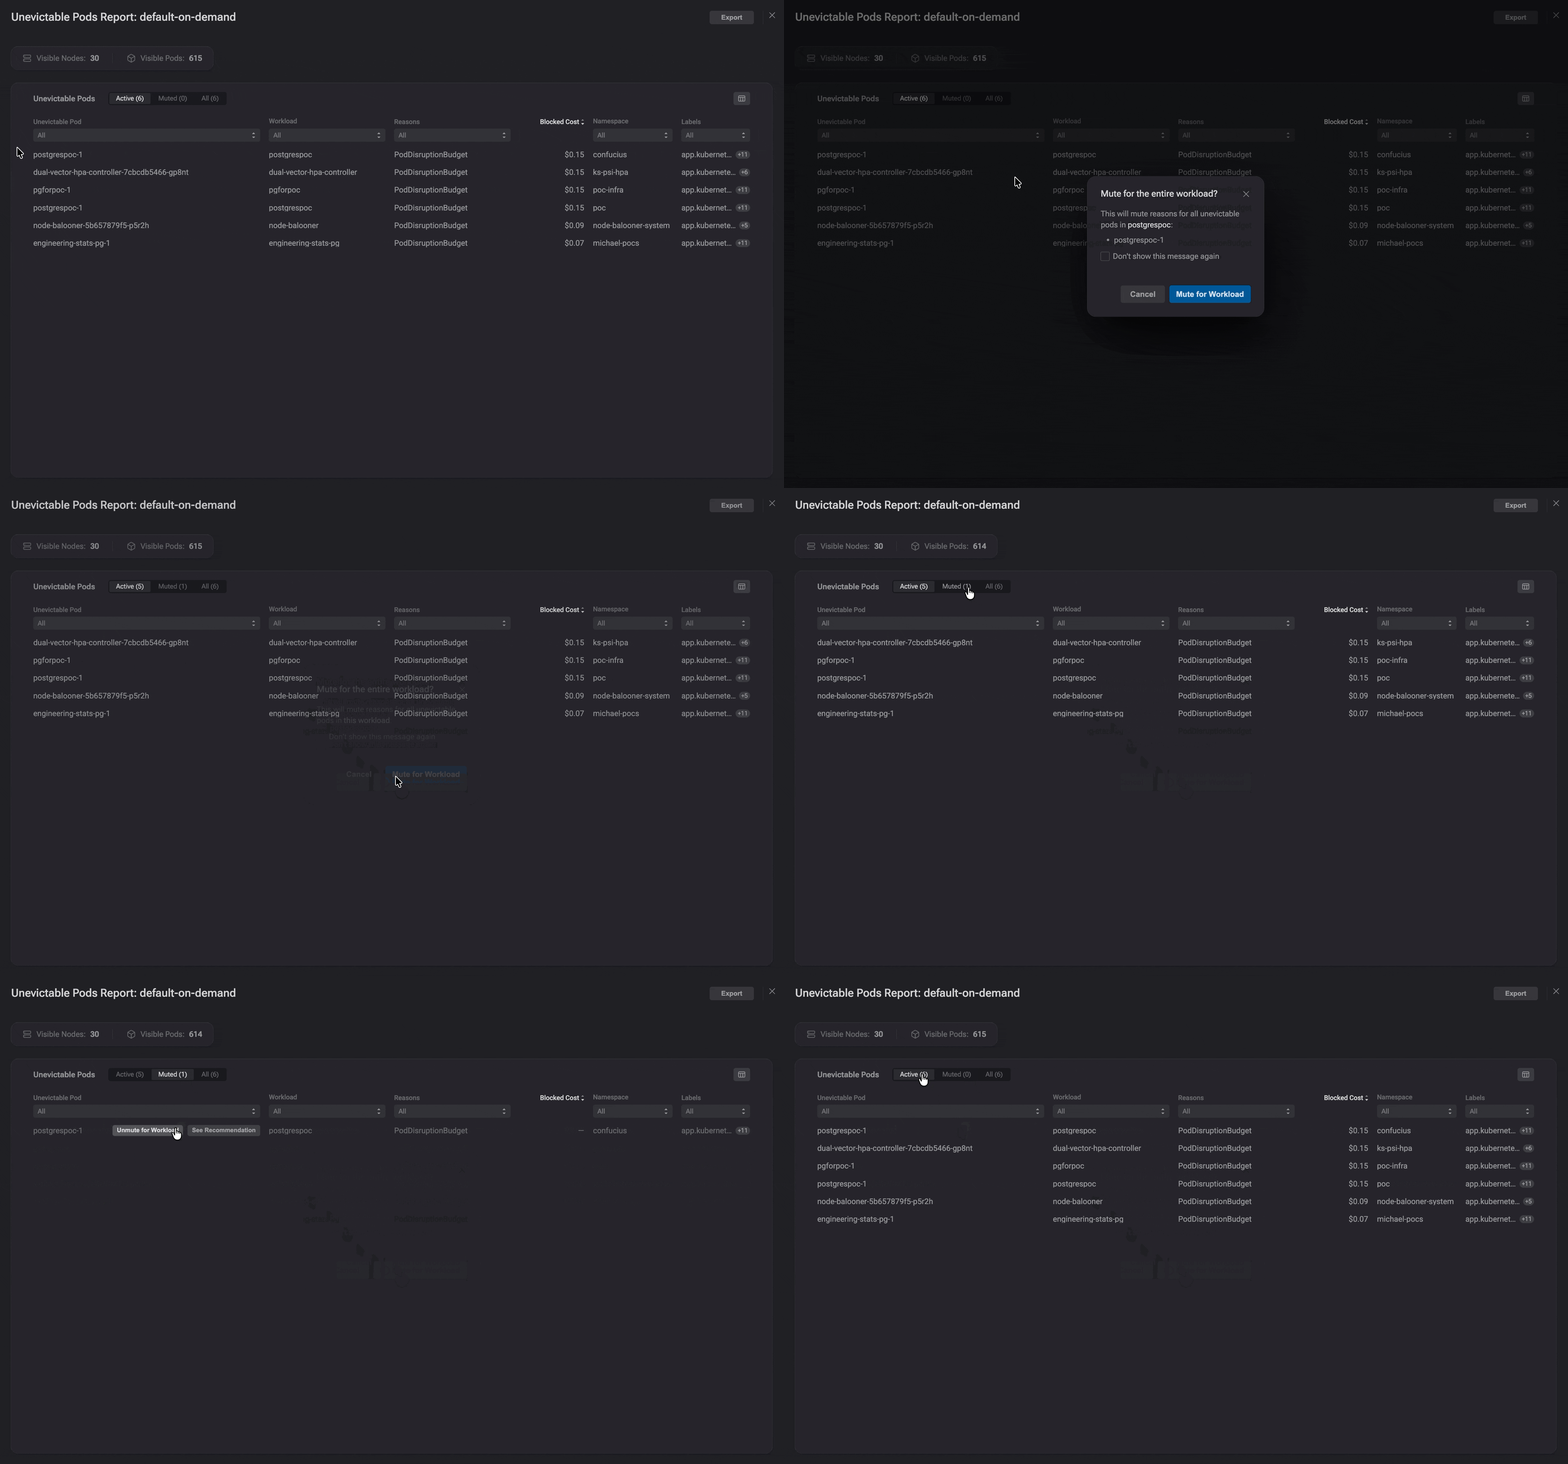
Mute finding
The Active and Muted tabs give you visibility into all findings, making it easy to see which ones still in a backlog and require attention, and which are muted.