GPU optimization — SaaS
PerfectScale now only supports NVIDIA Data Center GPU Manager (DCGM).
GPU support is available starting with the exporter version 1.0.55.
GPU memory support is available starting with the exporter version 1.1.11.
PerfectScale delivers exceptional GPU and GPU memory utilization visibility to monitor and optimize GPU resources within your Kubernetes clusters. This feature helps teams identify optimization opportunities, reduce resource waste, and improve overall K8s efficiency.
To enable GPU visibility support in PerfectScale, the NVIDIA DCGM exporter should be installed. Additionally, specific configuration parameters should be set when deploying or upgrading the PerfectScale agent. Learn more here.
When PerfectScale detects active GPU resources within a cluster, it automatically enables GPU and GPU memory widgets and utilization insights in the UI.
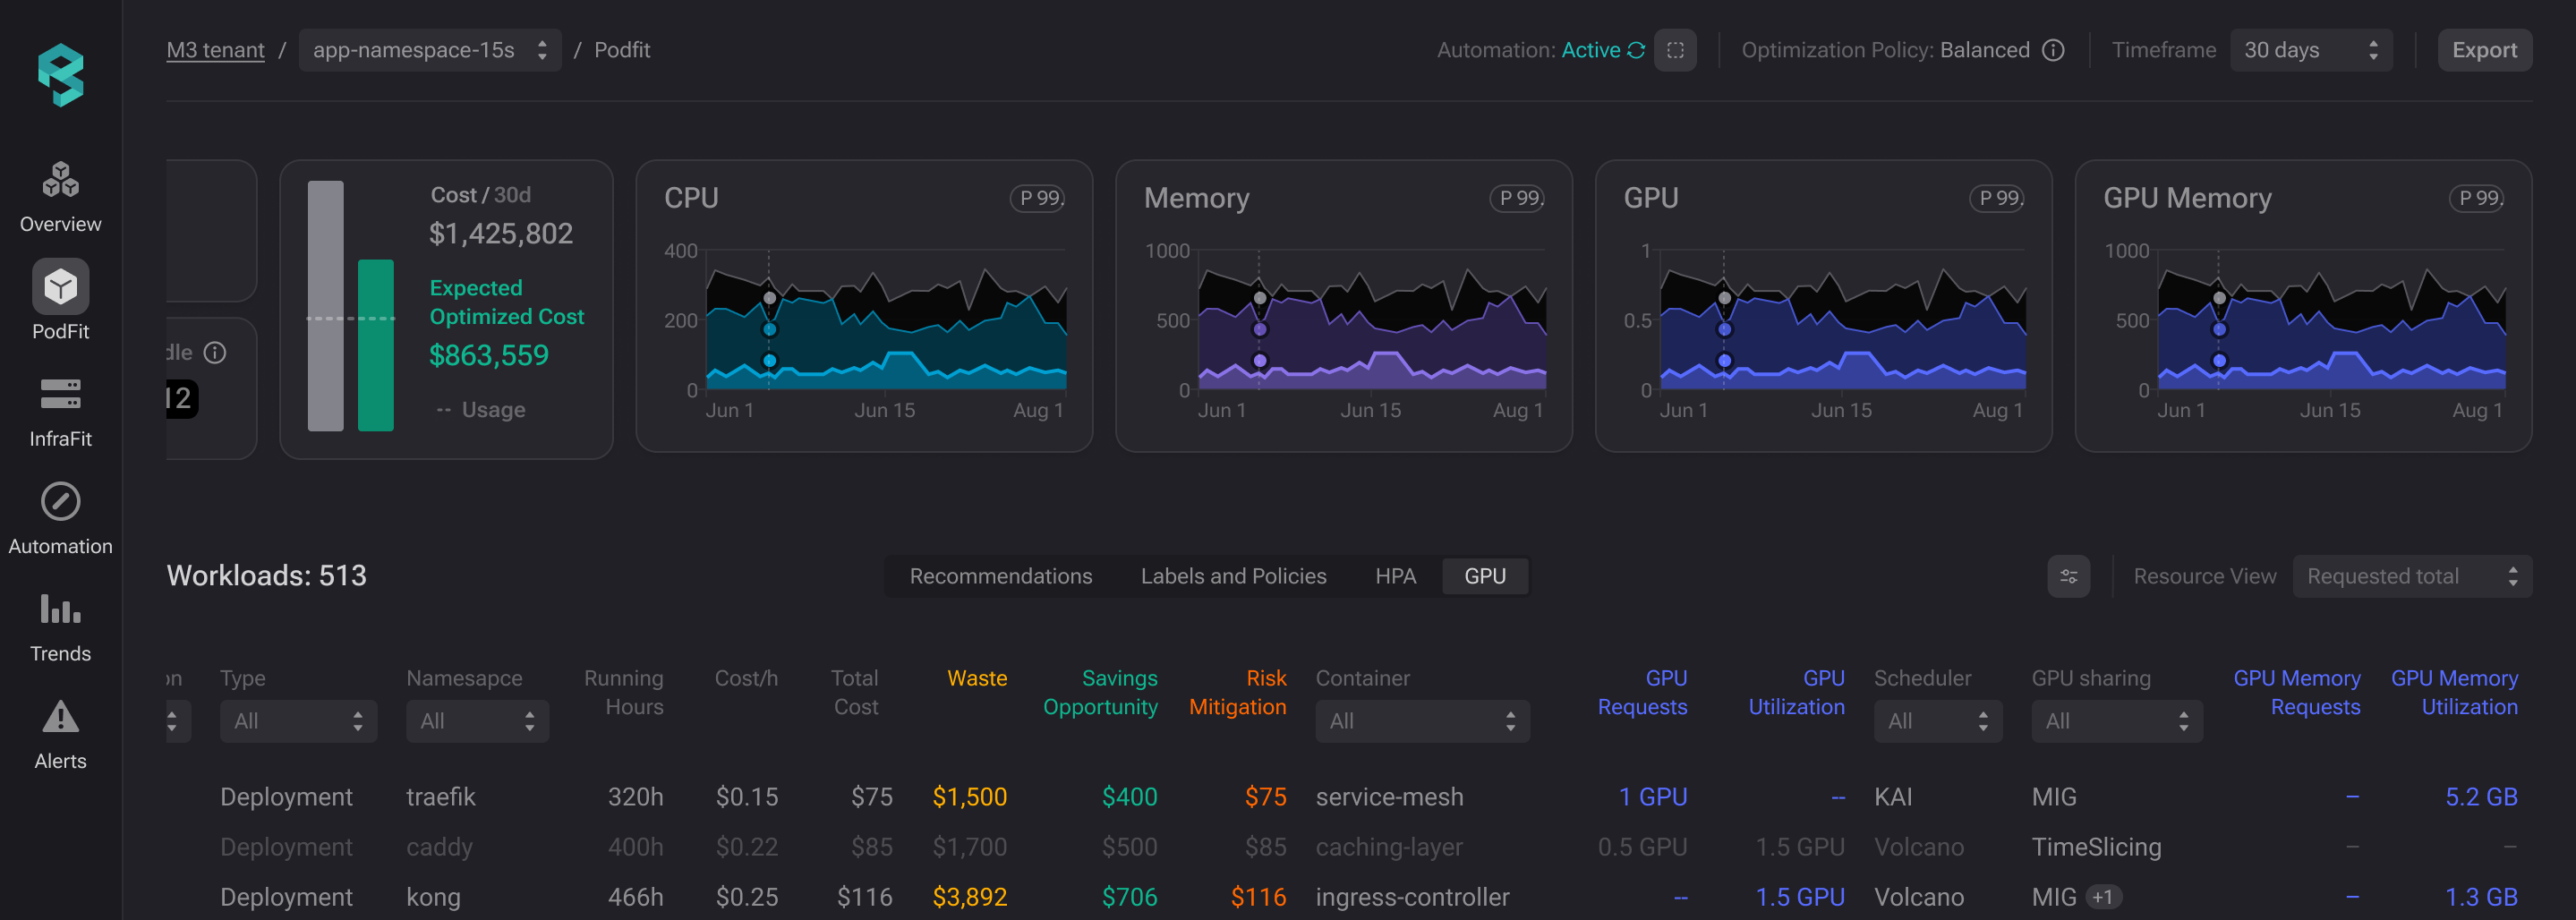
GPU widgets
This view provides detailed GPU usage and allocation efficiency metrics, helping you identify savings opportunities and drive further data-driven Kubernetes optimization.
Podfit GPU visibility
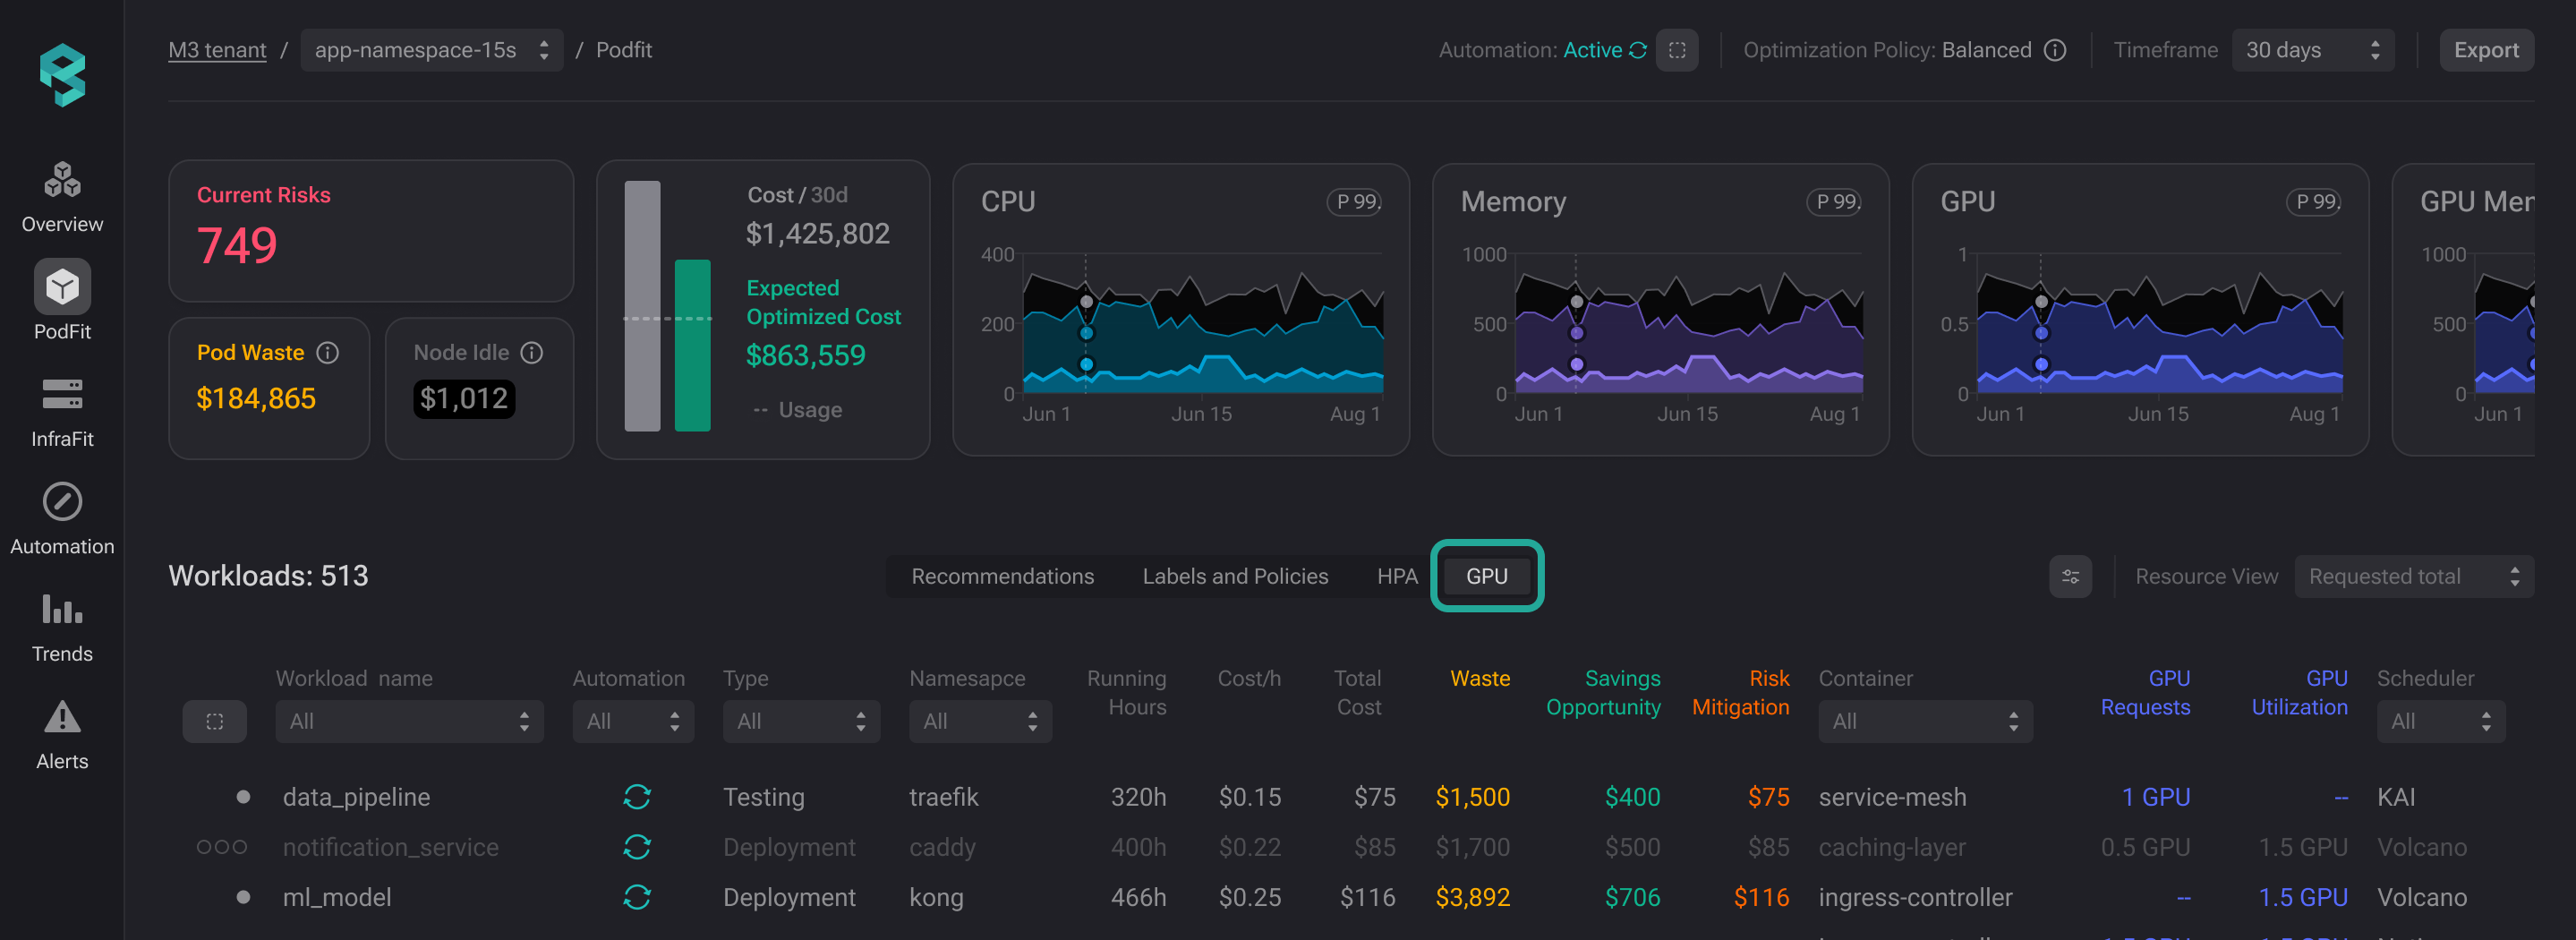
GPU view
To quickly identify GPU-allocated workloads in PodFit, switch to the GPU view by clicking the GPU tab from the view selector, as shown below. Once there, you will see the GPU and GPU memory utilization metrics per container, as well as the GPU scheduler type, for example, KAI, and the sharing type, for example, TimeSlicing. Sort the table by GPU usage to bring all GPU-consuming workloads to the top.
Clicking on a specific workload opens the detailed workload view - Zoom-in window. This panel provides in-depth information about the workload’s current state and behavior, along with historical data on resource allocation and utilization over time. It includes GPU and GPU memory utilization metrics as well as other key workload metrics. Learn more about zoom-in capabilities here.
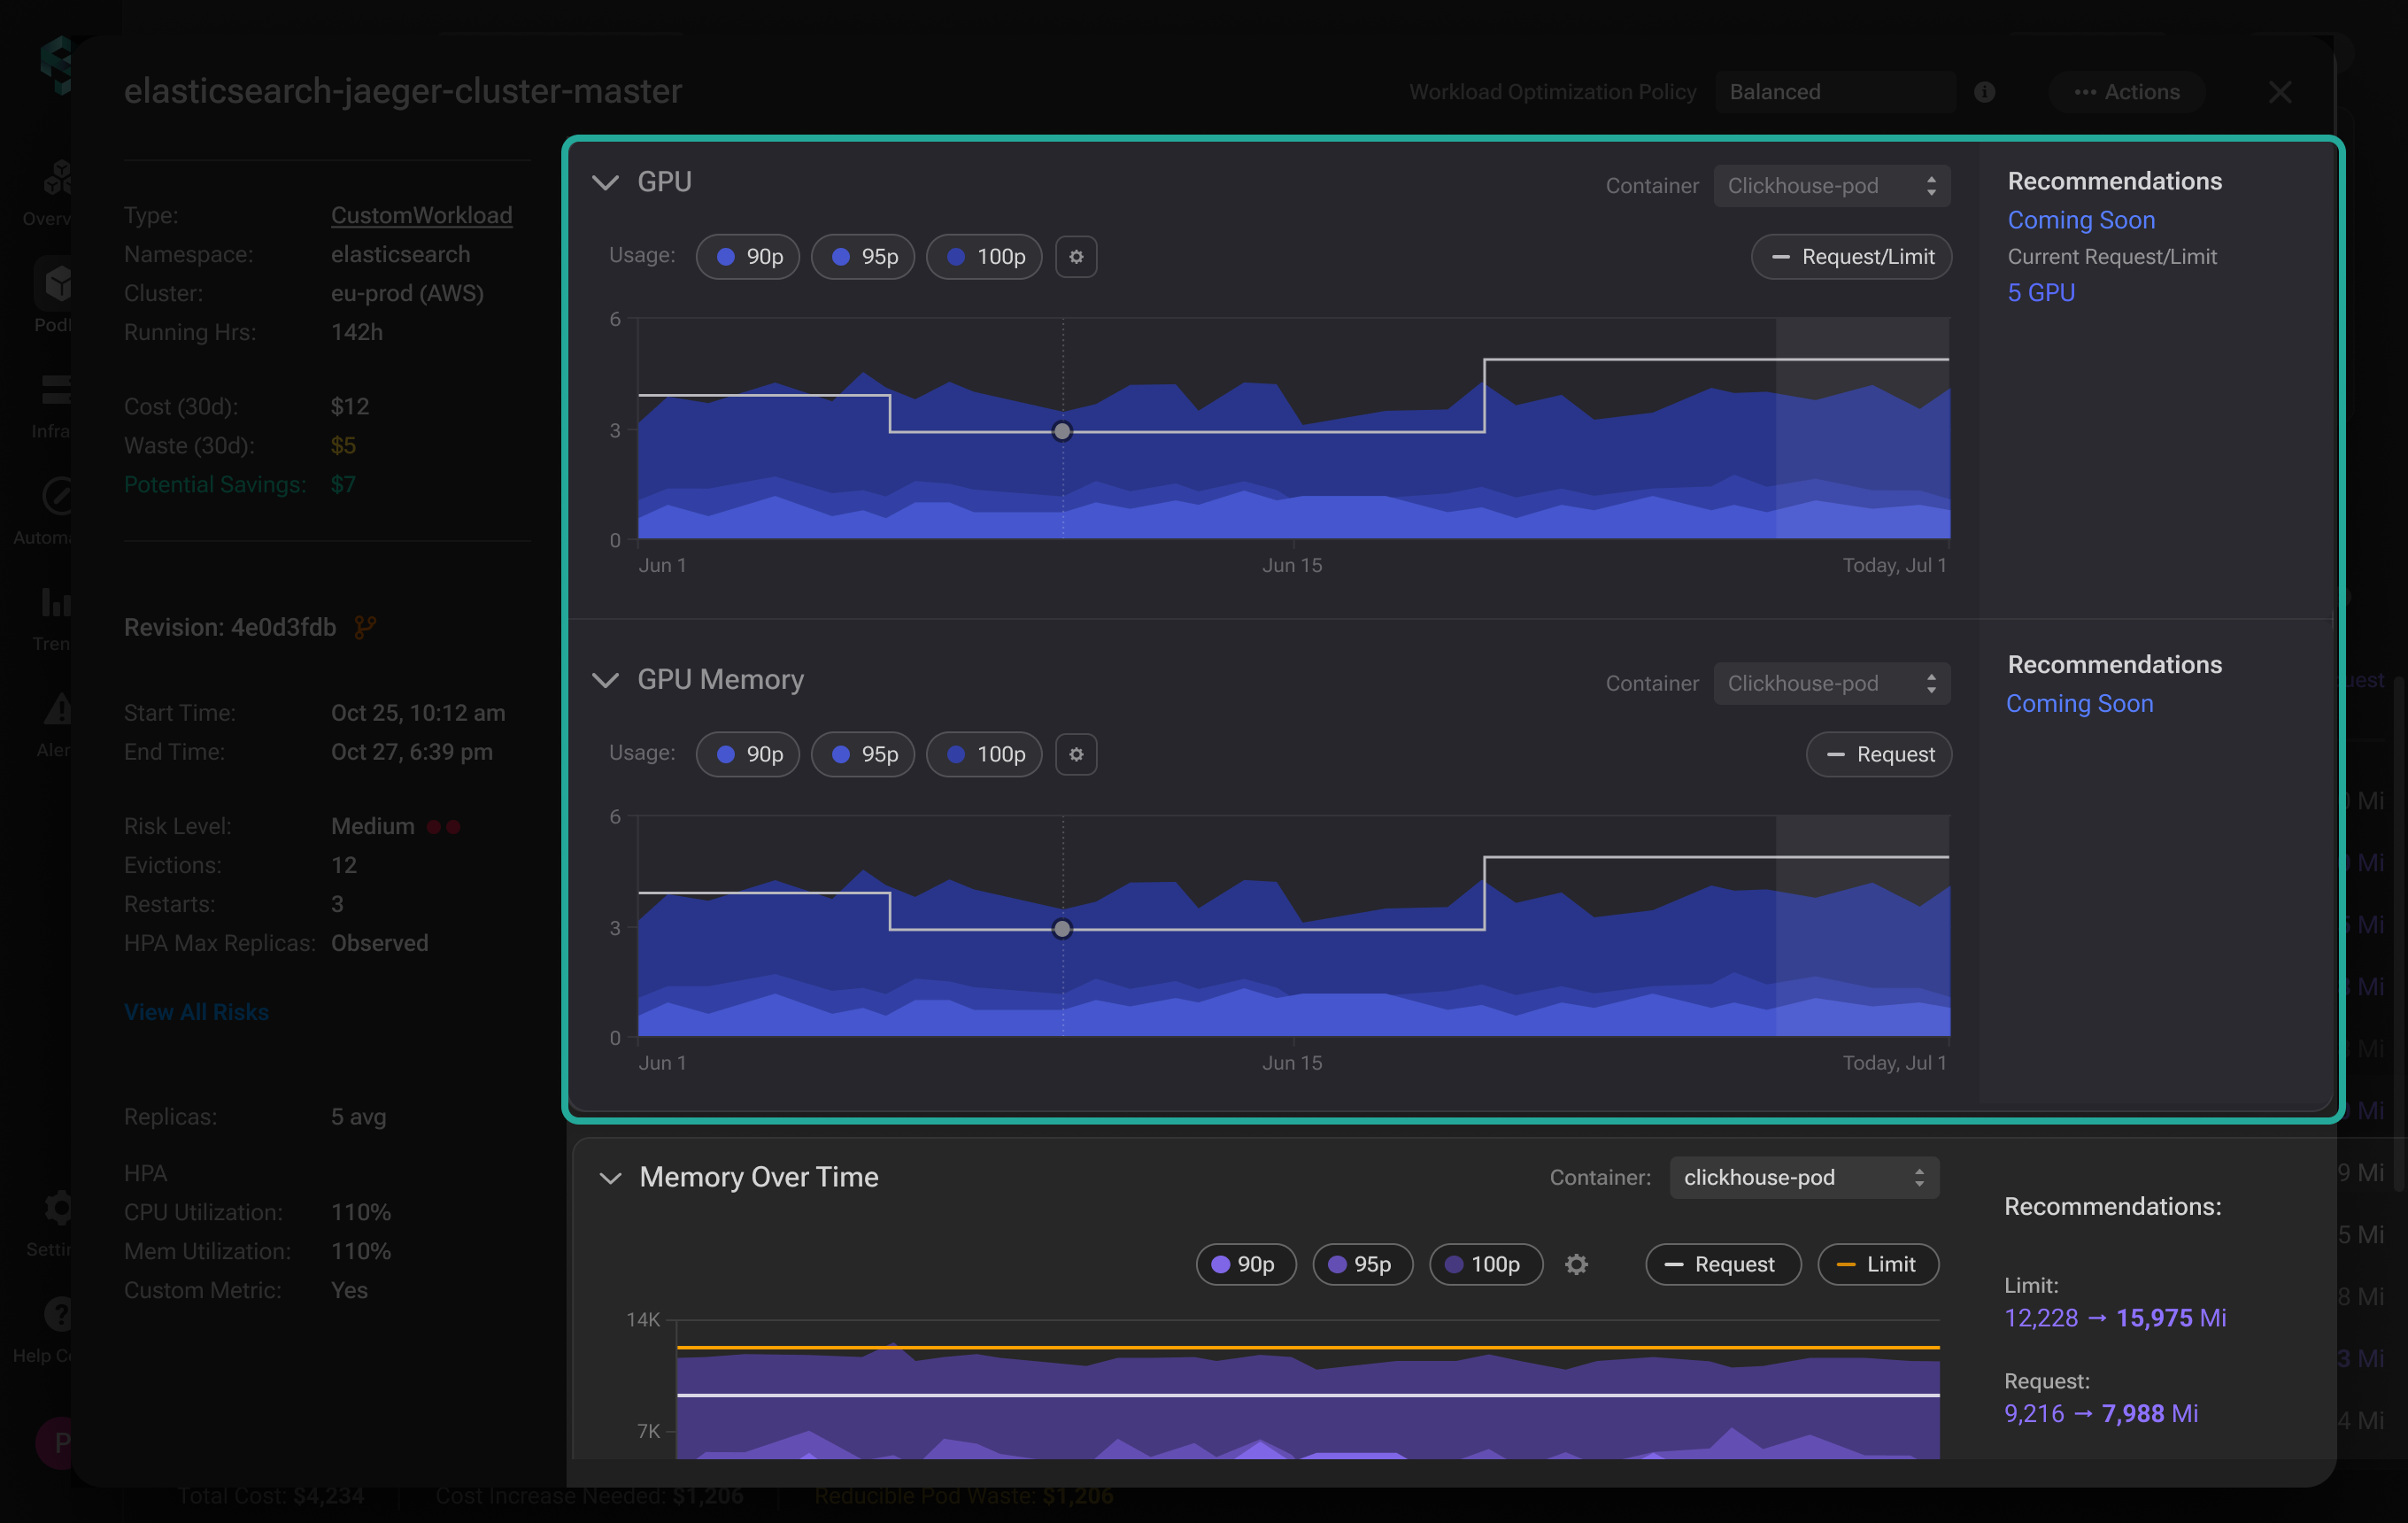
Workload GPU utilization widgets
Infrafit GPU visibility
To see detailed GPU usage across your infrastructure, go to InfraFit. The GPU chart shows how much of your GPUs are being used versus how much was requested, making it easy to spot inefficiencies and find ways to optimize.
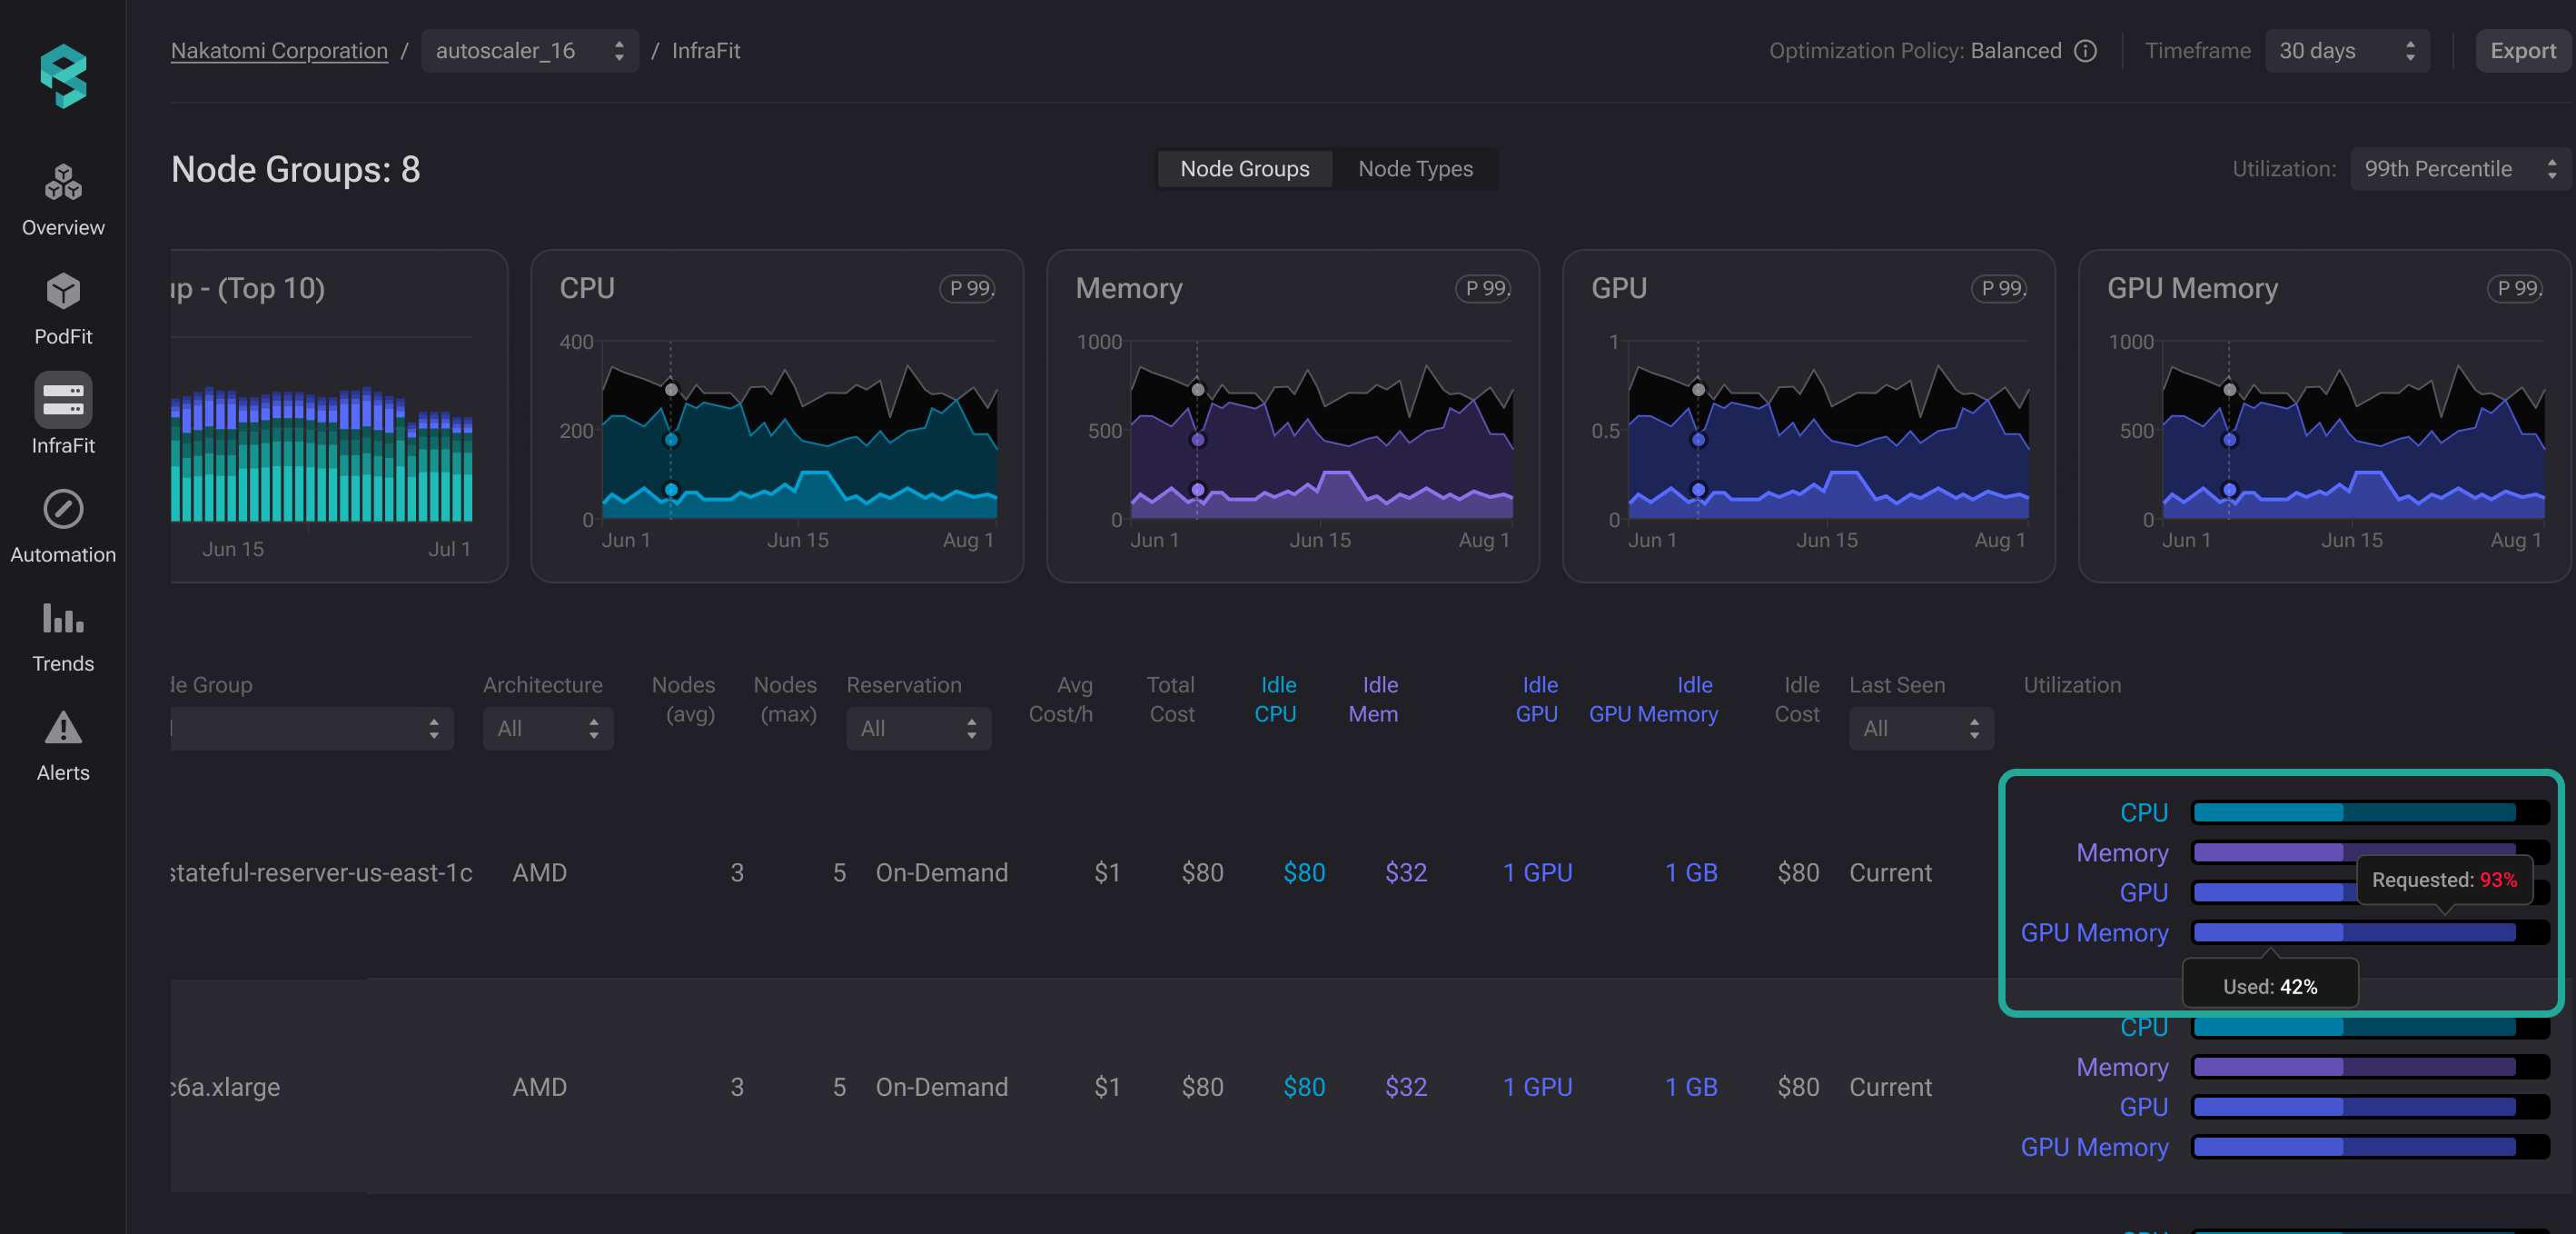
Node group GPU utilization
This view helps you quickly evaluate the difference between requested GPU and GPU memory resources and actual usage, making it easy to pinpoint underutilized or idle GPU capacity across your clusters.
By clicking on the specific node group, you will get a granular breakdown of individual instances within that group, along with key metrics for each one.
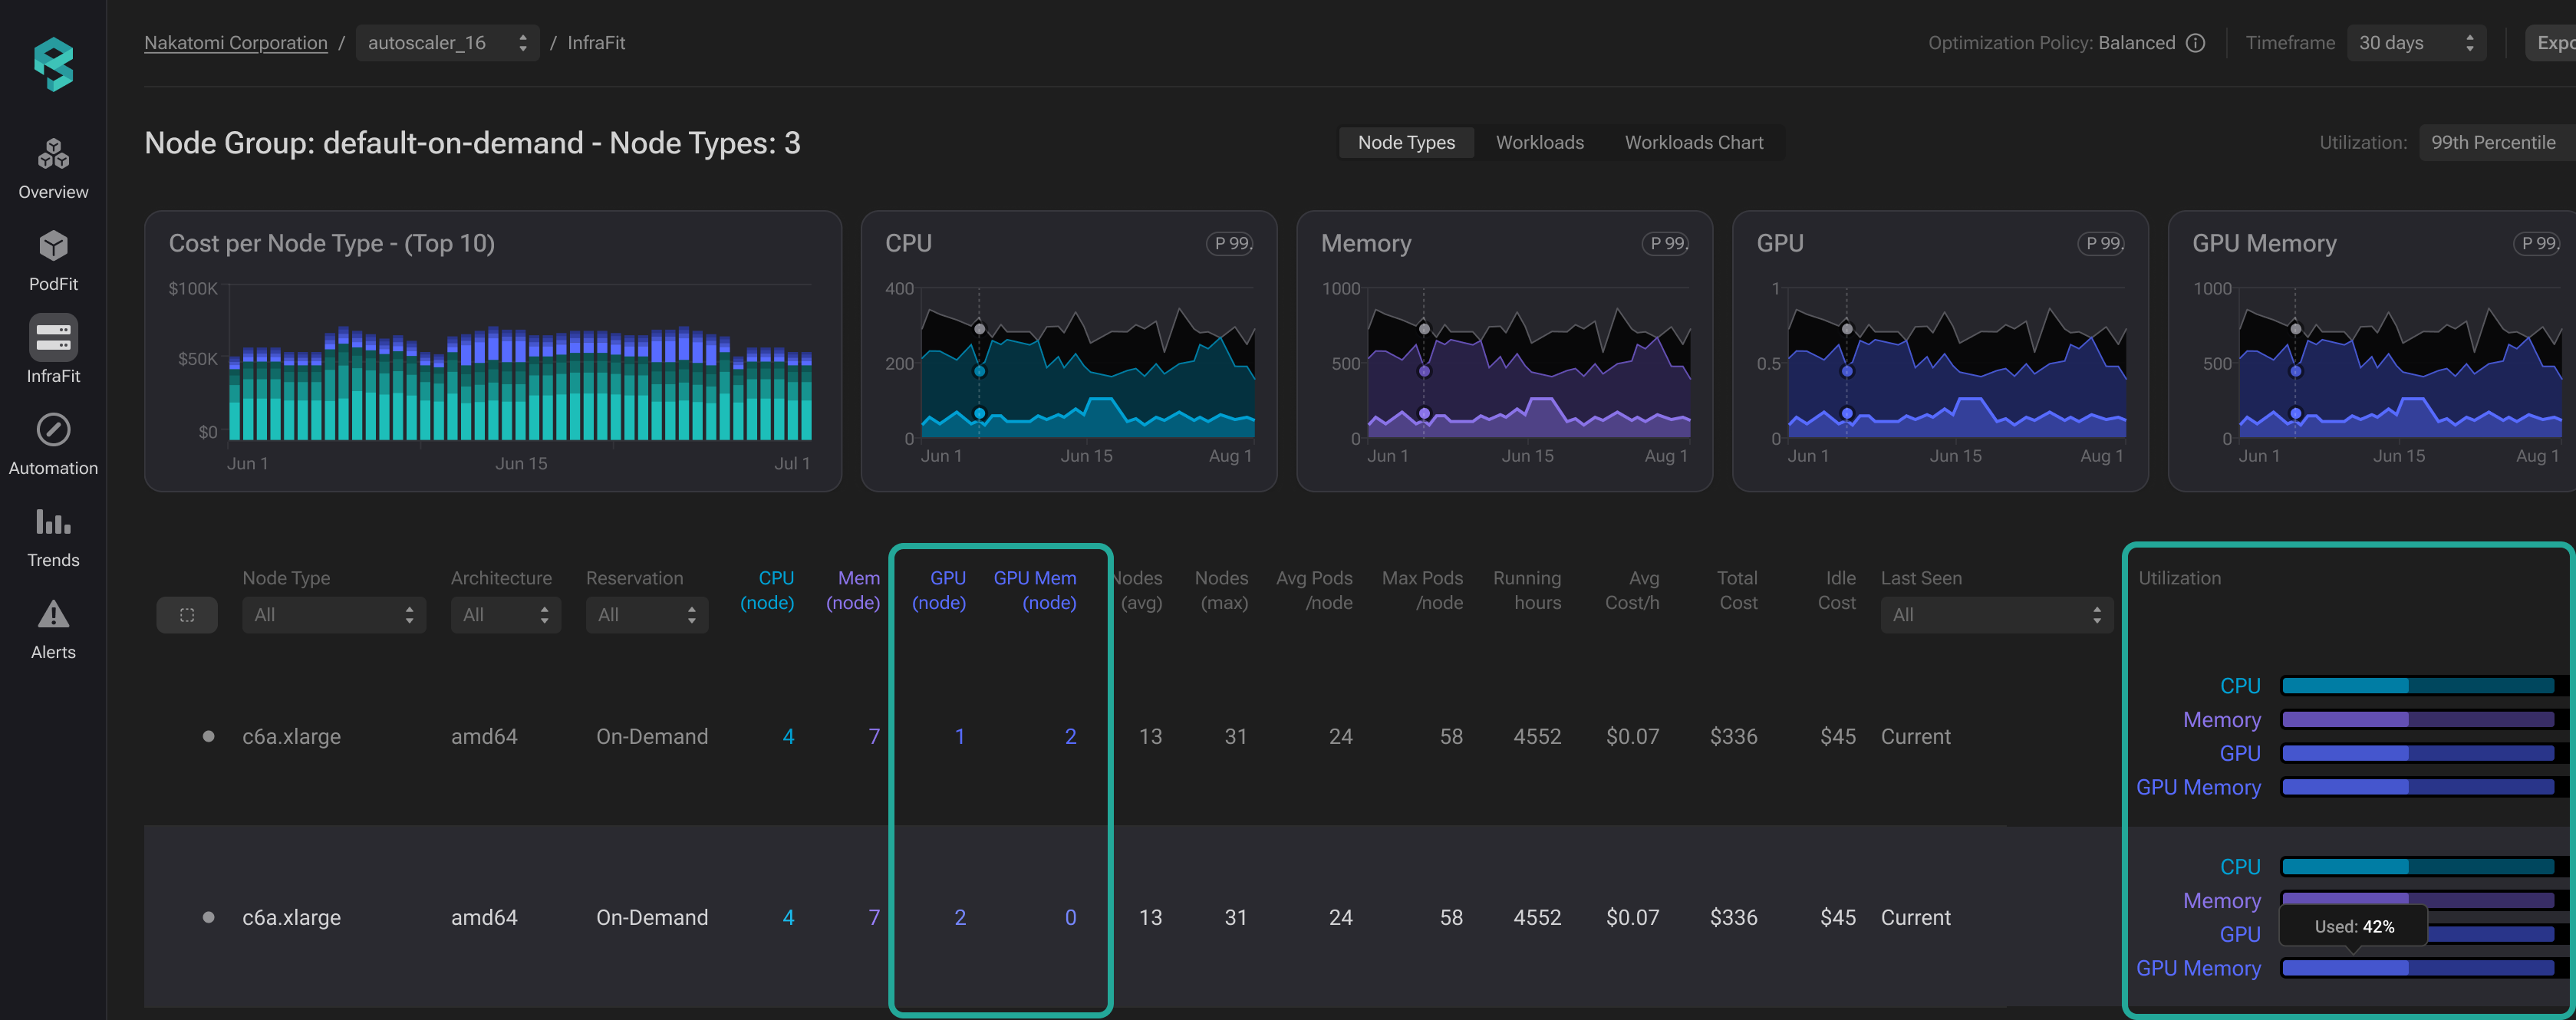
Node type GPU utilization
Clicking on a specific instance will display a list of workloads running on that machine, allowing for deeper investigation and analysis.