ダッシュボード
ダッシュボードは、収益・利用状況・マージン・運用状態などの主要な観点に対するレポートや可視化を集約し、財務データおよび運用データへの可視性を提供します。
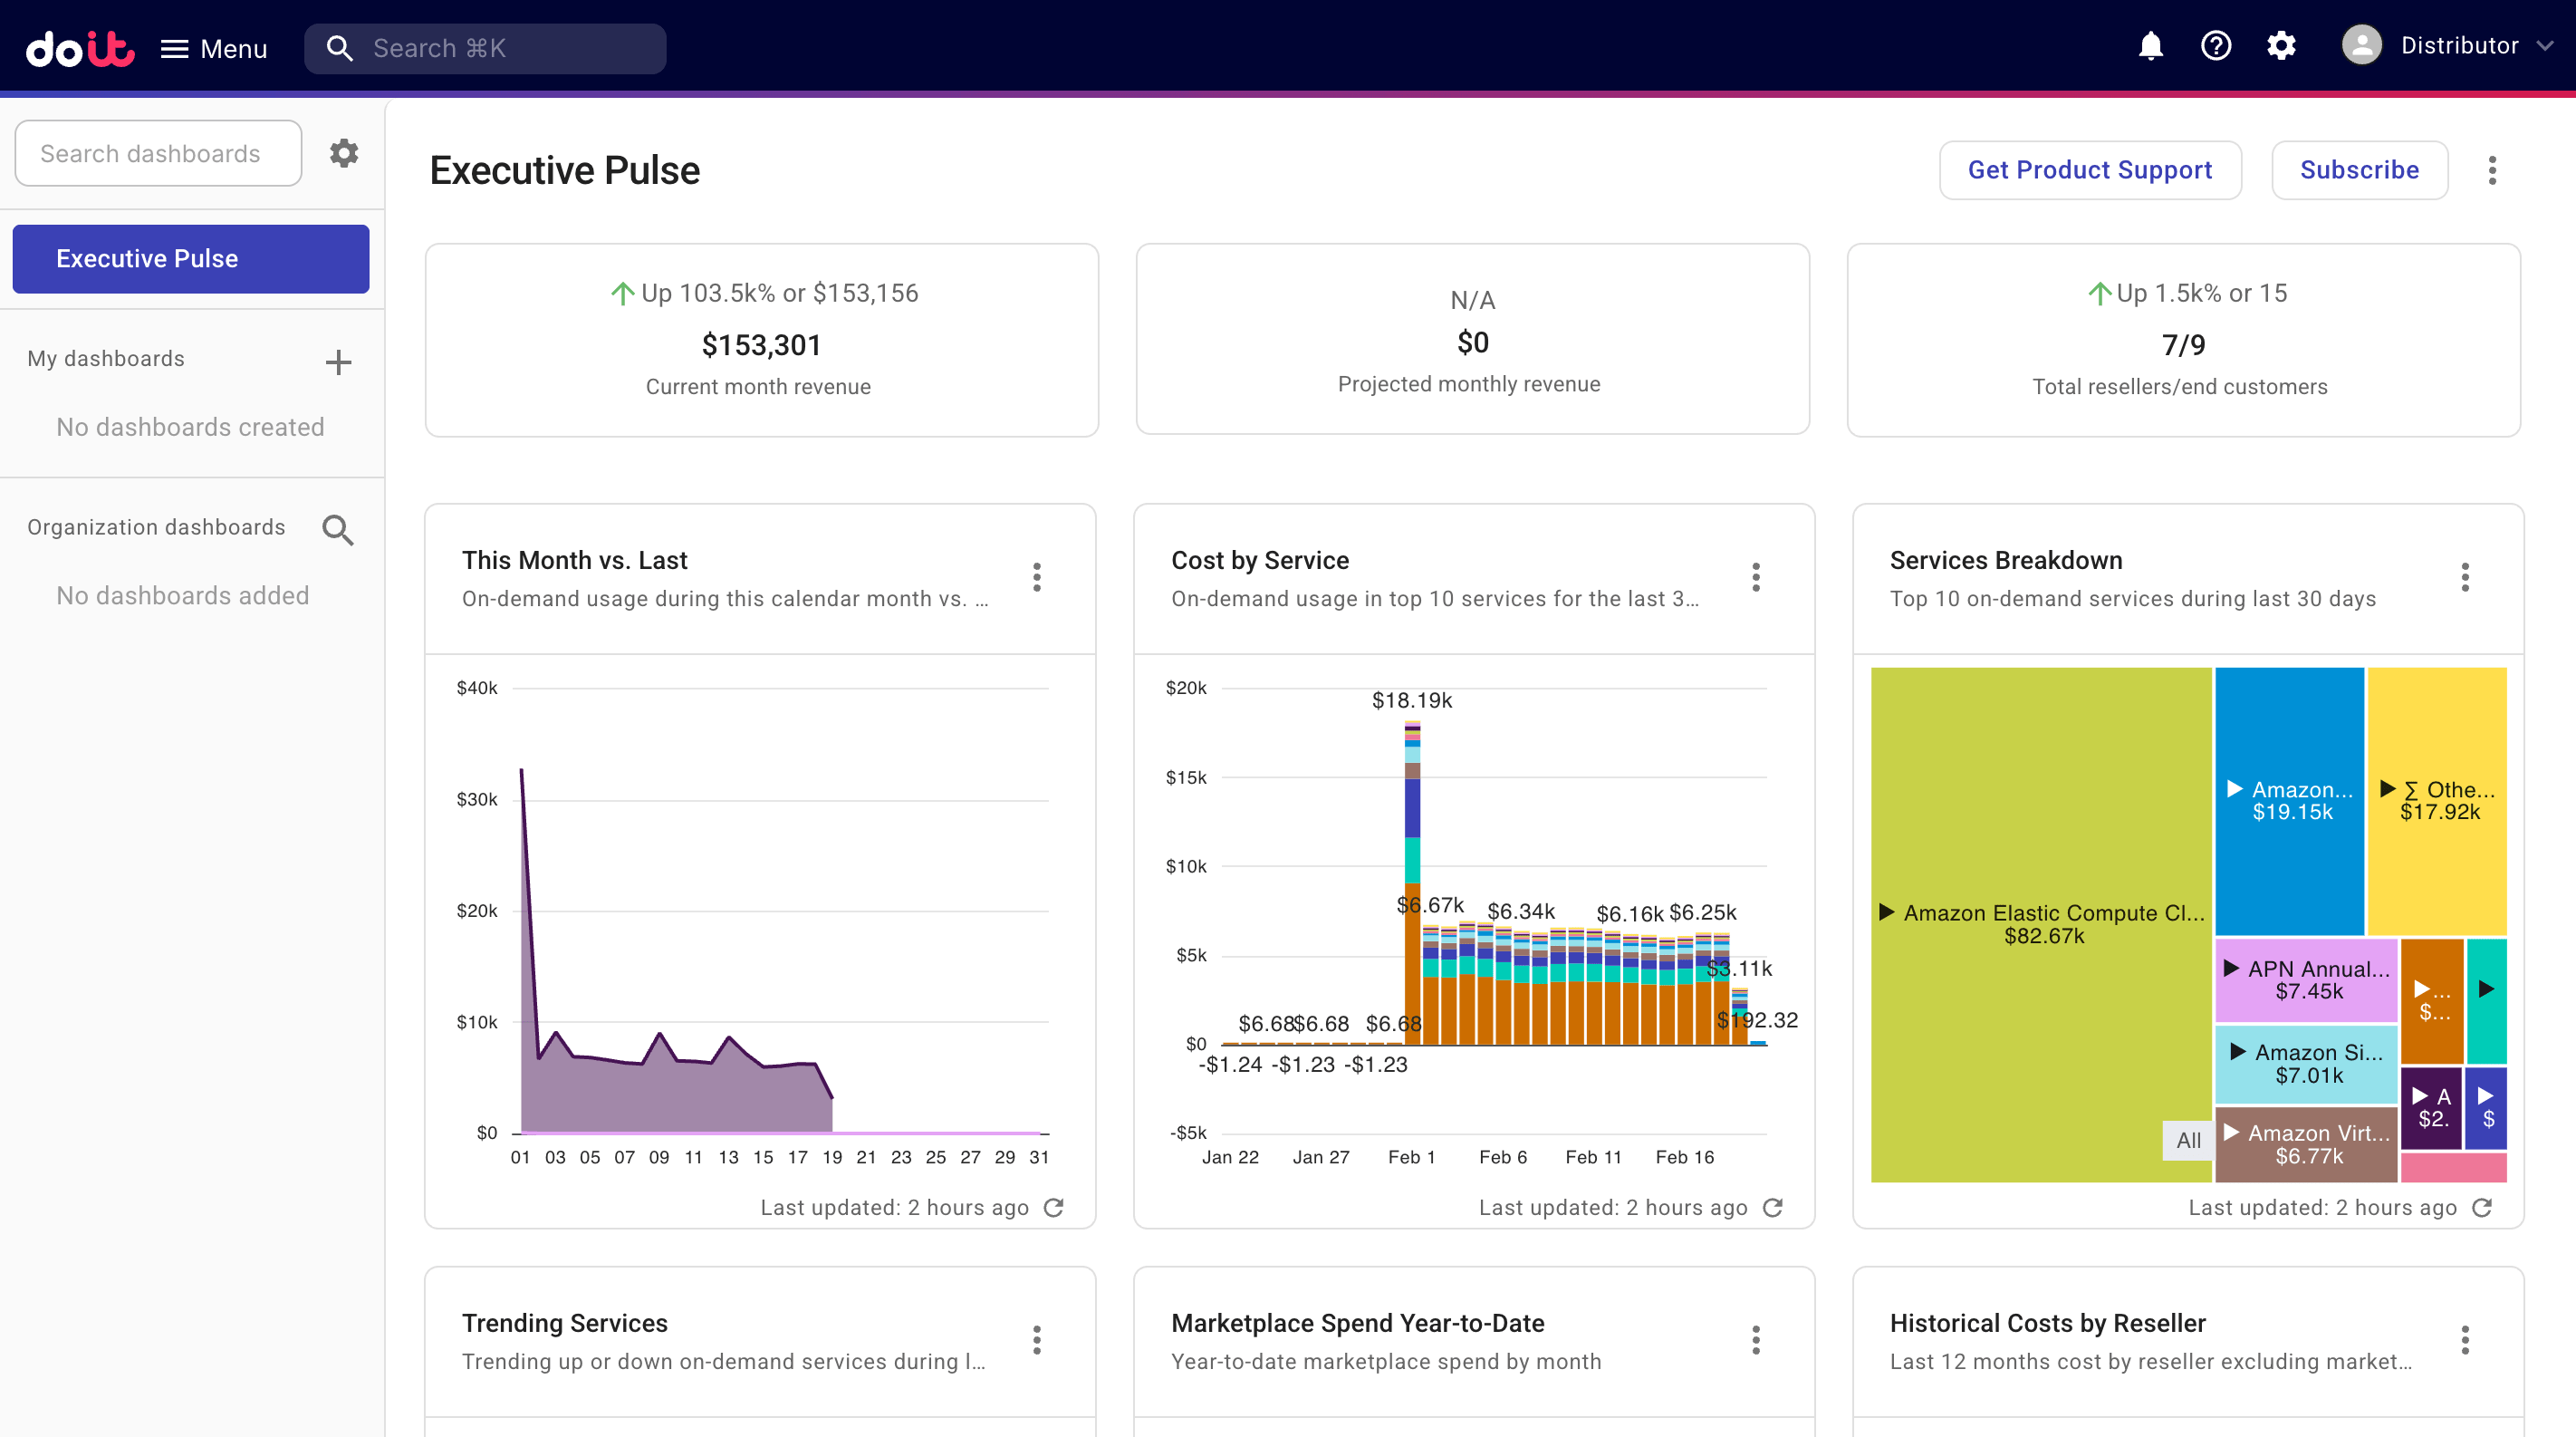
Executive Pulse
Executive Pulse ダッシュボードにアクセスするには、上部ナビゲーションのメガメニューから Dashboards を選択してください。
-
このダッシュボードは 2 つの部分で構成されます。サマリーカード が 3 枚と、プリセットレポートウィジェット のグループです。
-
Get Product Support オプションはディストリビューターレベルでのみ利用可能です。
Summary cards
最初の 2 つのサマリーカードは、収益の 金額 と トレンド を含む高レベルな収益パターンを示し、最後のサマリーカードは過去 30 日間の顧客数の合計を示します。
| Item | Current month revenue | Projected monthly revenue |
|---|---|---|
| Revenue amount | 当月カレンダーマンスの総収益 | 当月カレンダーマンス末までの収益に関する ML 予測 |
| Trend | 当月の収益が前月の同期間とどのように比較されるか | 当月収益の予測が翌月の予測とどのように比較されるか |
通常、サマリーカードは 12 時間ごとに更新されます。
サマリーカード上の数値を選択すると、詳細を確認できます。
-
Current month revenue の金額を選択すると、過去 30 日間の収益を表示するレポートが開きます。
-
Projected monthly revenue の金額を選択すると、今後 12 か月間の予測を表示するレポートが開きます。
-
顧客カード上の数値を選択すると、Customers ページが開きます。
Preset report widgets
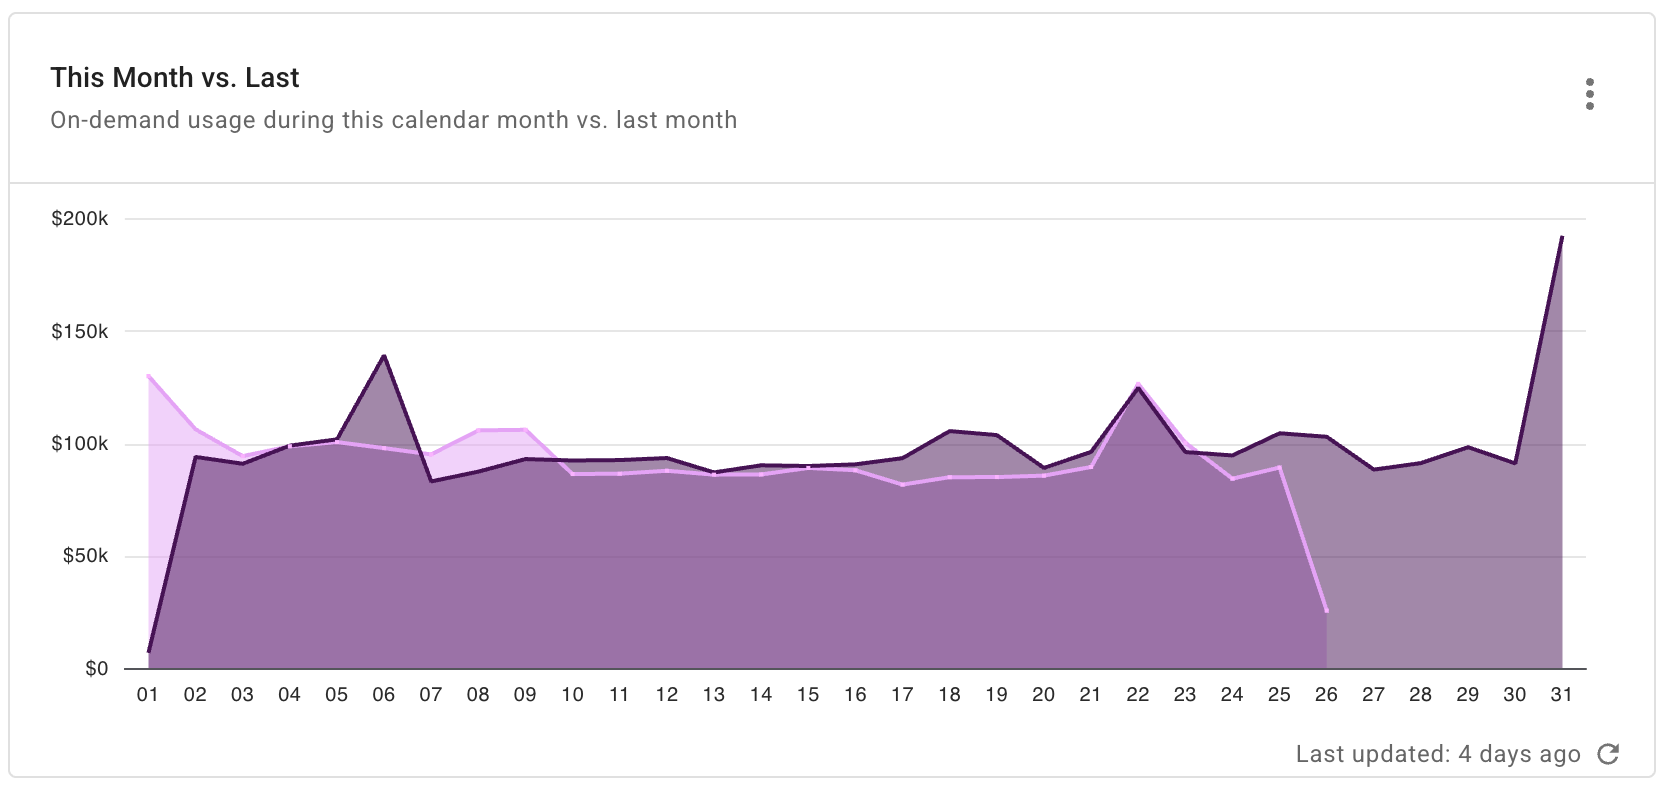
This Month vs. Last
This Month vs. Last ウィジェットは、当月のカレンダーマンスと前月におけるオンデマンド利用状況のエリアチャートを表示します。
レポート設定:
- Metrics: Cost
- Time Range: Last 2 months (include current month)
- Time Interval: Day
- Exclude partial intervals: Yes
- Filter results:
- Cost Type is not
CreditorCredit Adjustment - Credit not matches regexp
^GFS Cloud
- Cost Type is not
- Group by: Year, Month
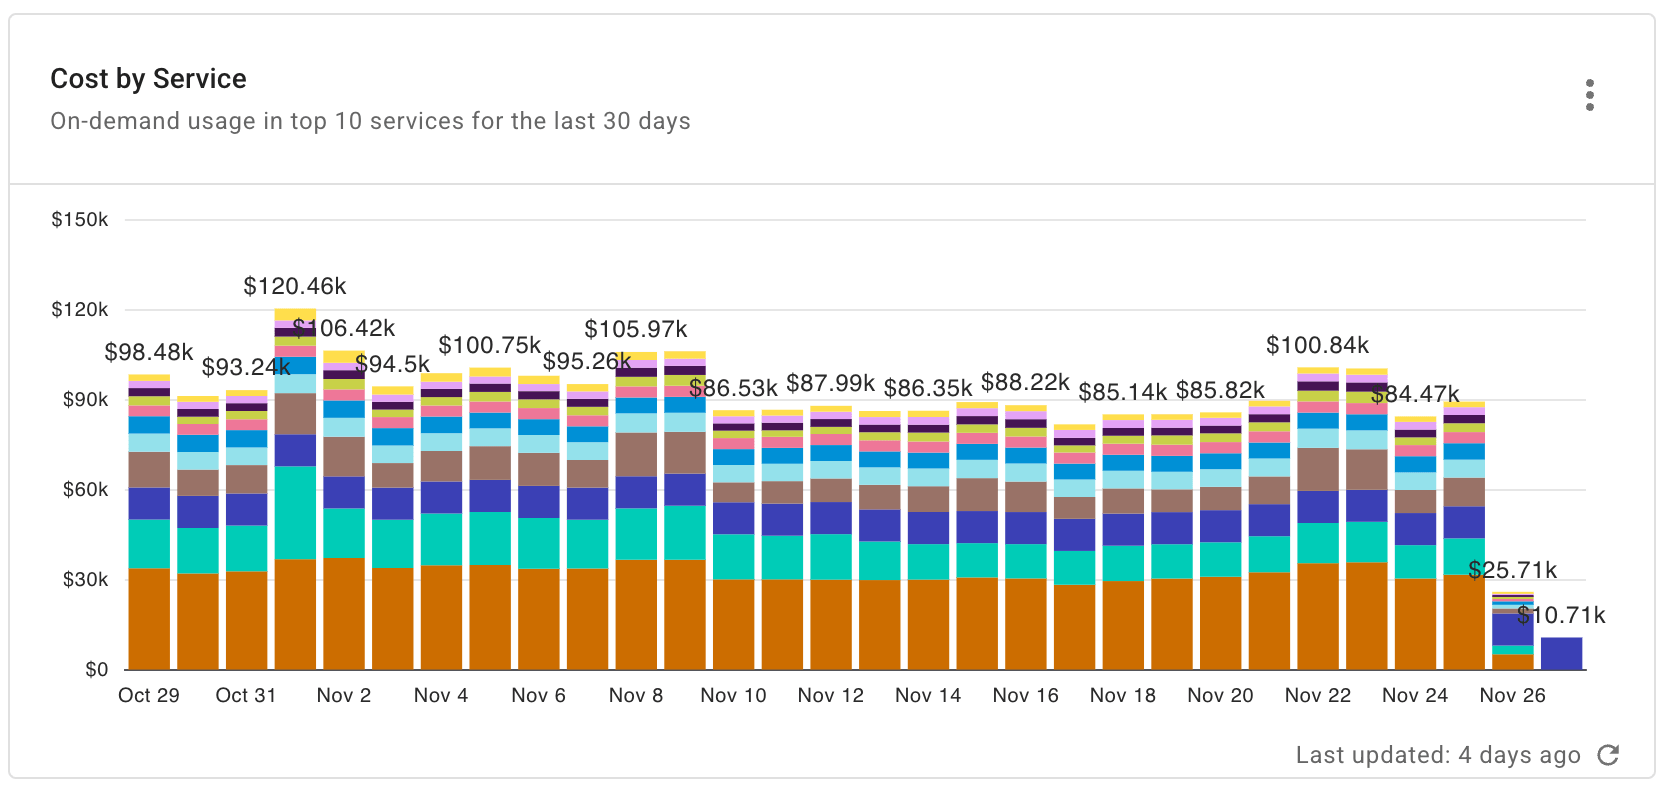
Cost by Service
Cost by Service ウィジェットは、過去 30 日間のトップ 10 サービスにおけるオンデマンド利用状況を表示します。
レポート設定:
- Metrics: Cost
- Time Range: Last 30 days (include current day)
- Time Interval: Day
- Filter results:
- Allocation rule is not
AWS RIs, SPsorAWS Support - Cost Type is not
CreditorCredit Adjustment - Service is not
Invoice
- Allocation rule is not
- Group by: Service
- Limit results:
- Limit by value: Cost not between -$1.00 AND U$1.00
- Limit by top/bottom: Service—Limit to top 10 by cost
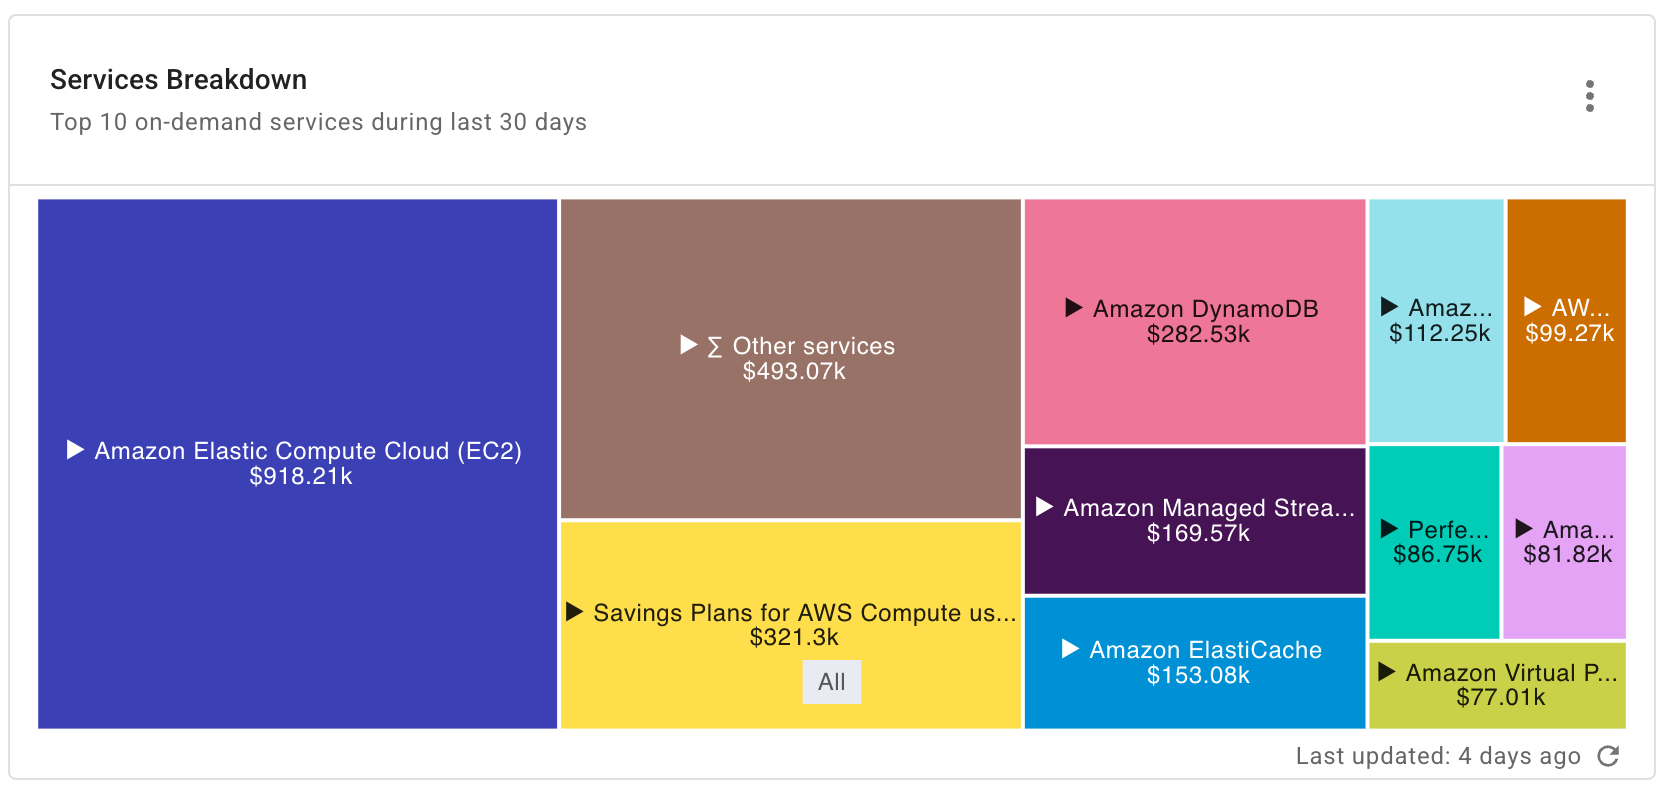
Services Breakdown
Services Breakdown ウィジェットは、過去 30 日間のトップ 10 のオンデマンドサービスを示すツリーマップを表示します。
レポート設定:
- Metrics: Cost
- Time Range: Last 30 days (include current day)
- Time Interval: Day
- Filter results:
- Cost Type is not
CreditorCredit Adjustment - Credit not matches regexp
^GFS Cloud - Service is not
Invoice
- Cost Type is not
- Group by: Service, SKU
- Limit results:
- Limit by value: Cost not between -$1.00 AND $1.00
- Limit by top/bottom: Service—Limit to top 10 by cost; SKU—Limit to top 10 by cost
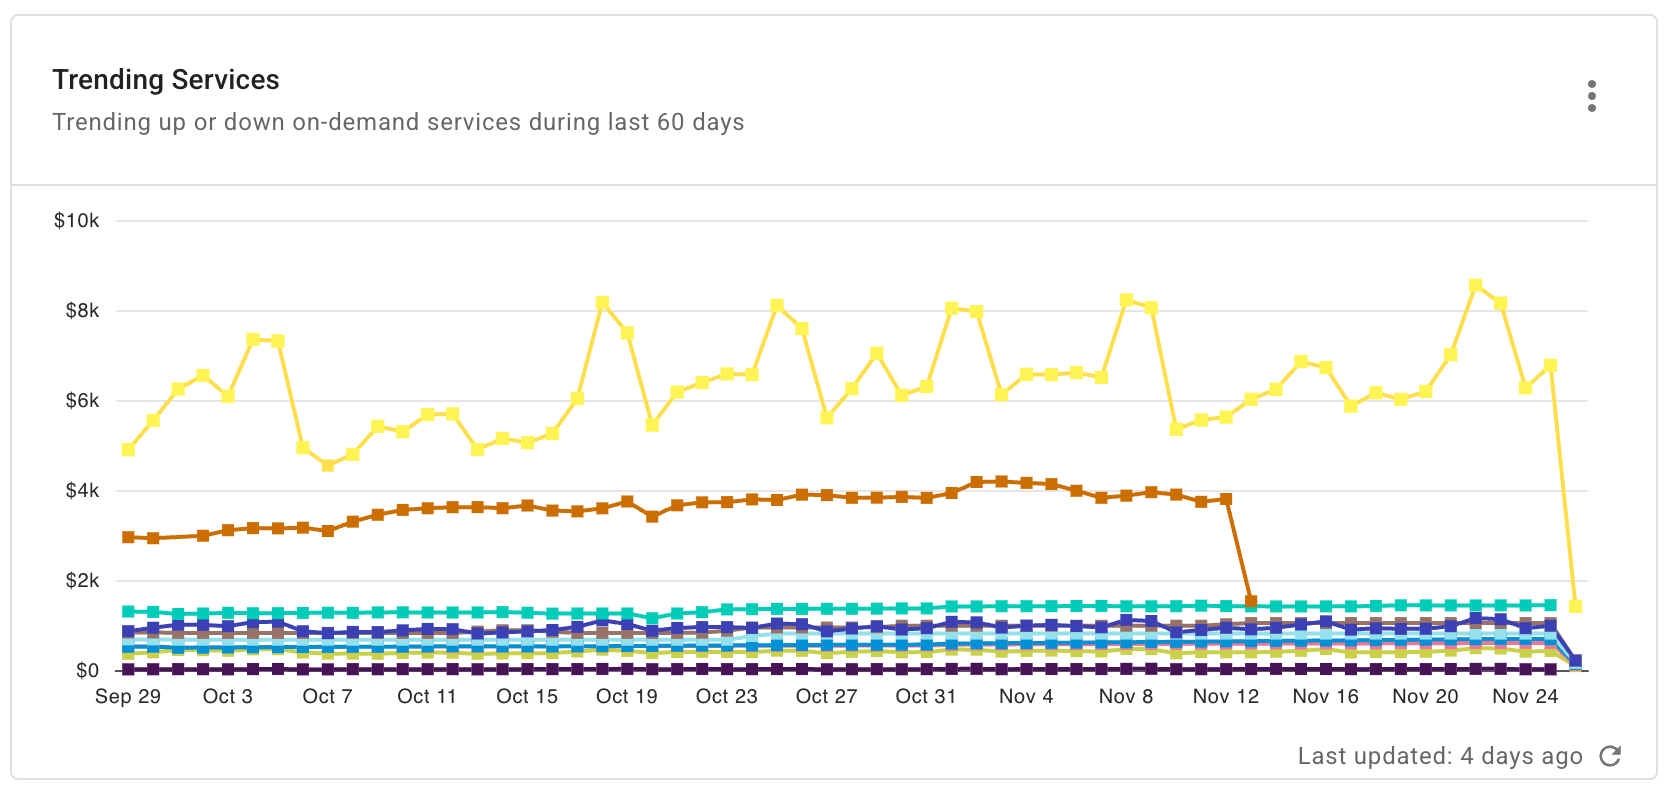
Trending Services
Trending Services ウィジェットは、過去 60 日間においてオンデマンドサービスが上昇トレンドか下降トレンドかを表示します。
レポート設定:
- Metrics: Cost
- Time Range: Last 60 days (include current day)
- Time Interval: Day
- Exclude partial intervals: Yes
- Filter results:
- Allocation rule is not
AWS RIs, SPsorAWS Support - Cost Type is not
CreditorCredit Adjustment
- Allocation rule is not
- Group by: SKU, Service
- Limit results:
- Limit by value: Cost > $10.00
- Limit by top/bottom: SKU—Limit to top 10 by cost
- Advanced Options:
- Advanced Analysis: Trending Up
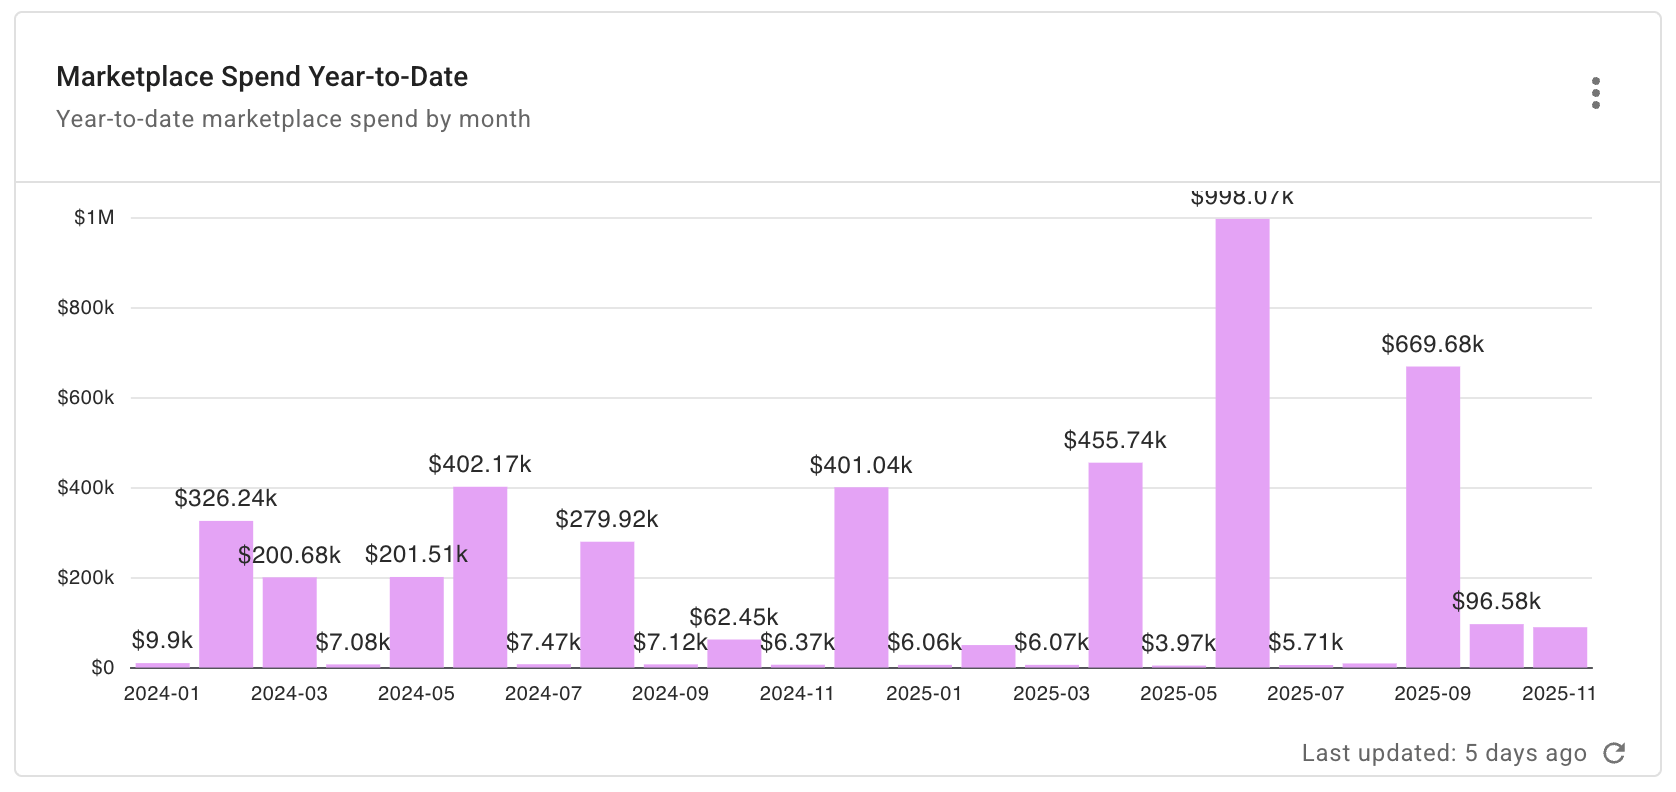
Marketplace Spend Year-to-Date
Marketplace Spend Year-to-Date ウィジェットは、年初来のマーケットプレイス支出を月別に積み上げ縦棒グラフで表示します。
レポート設定:
- Metrics: Cost
- Time Range: Last 2 years (include current year)
- Time Interval: Month
- Filter results:
- Marketplace is
true
- Marketplace is
- Group by: Provider, Service
- Limit results:
- Limit by value: Cost not between -US$0.10 AND US$0.10
- Limit by top/bottom: Service—Limit to top 10 by cost
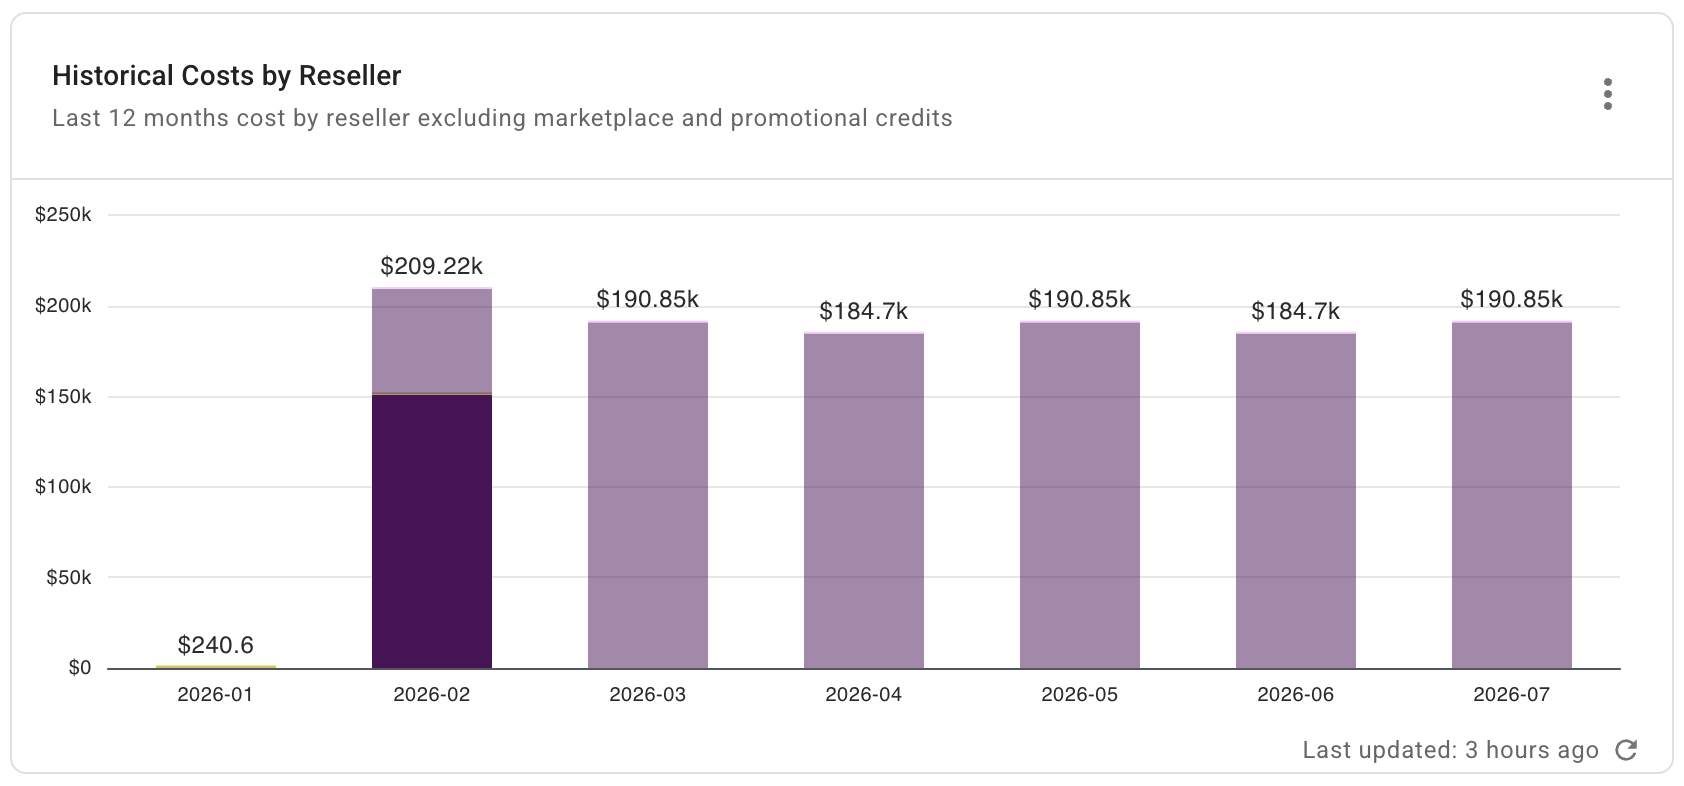
Historical Costs by Reseller (Distributor only)
Historical Costs by Reseller ウィジェットは、マーケットプレイスおよびプロモーションクレジットを除外した、過去 12 か月間のリセラー別コストを表示します。
レポート設定:
- Metric: Cost
- Time Range: Last 12 months (include current month)
- Time Interval: Month
- Filter results:
- Cost Type is not
CreditorCredit Adjustment - Marketplace is
false
- Cost Type is not
- Group by: Reseller Name
- Limit results:
- Limit by value: Cost not between -$0.10 AND $0.10
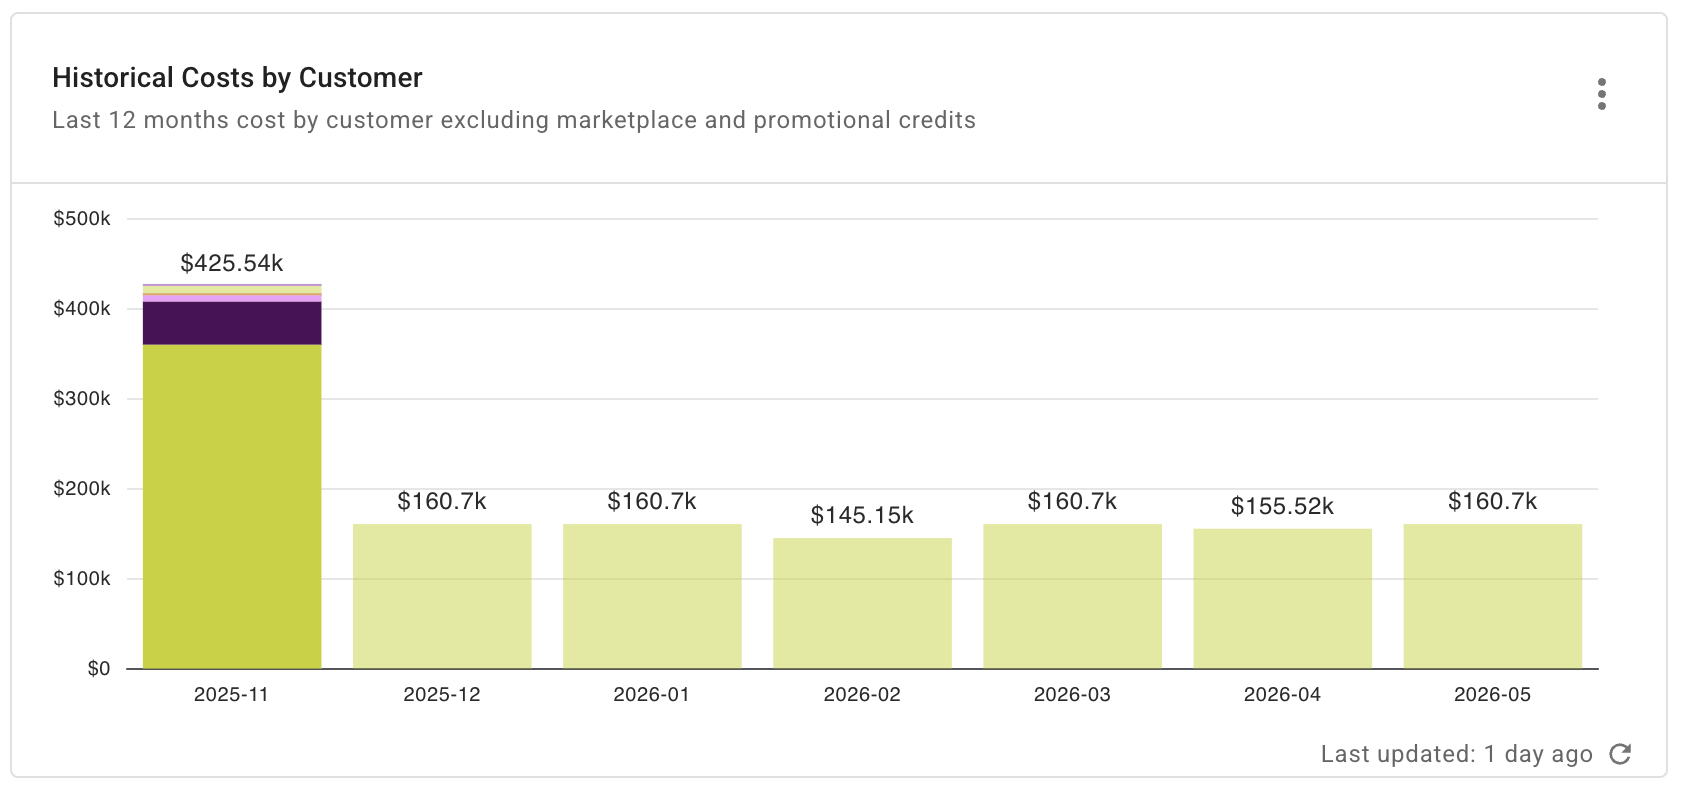
Historical Costs by Customer (Reseller only)
Historical Costs by Customer ウィジェットは、マーケットプレイスおよびプロモーションクレジットを除外した、過去 12 か月間の顧客別コストを表示します。
レポート設定:
- Metrics: Cost
- Time Range: Last 12 months (include current month)
- Time Interval: Month
- Filter results:
- Cost Type is not
CreditorCredit Adjustment - Marketplace is
false
- Cost Type is not
- Group by: Customer Name
- Limit results:
- Limit by value: Cost not between -$0.10 AND $0.10
Gross Margin
Gross Margin ウィジェットは、過去 12 か月間のマージン分析を表示します。

レポート設定:
- Metrics: Margin
- Time Range: Last 12 months (include current month)
- Time Interval: Month