Node type view — Self-hosted 2.0
Identify wasted node resources and gain optimization insights to select the right nodes to better serve your environment's needs with the Node Types view.
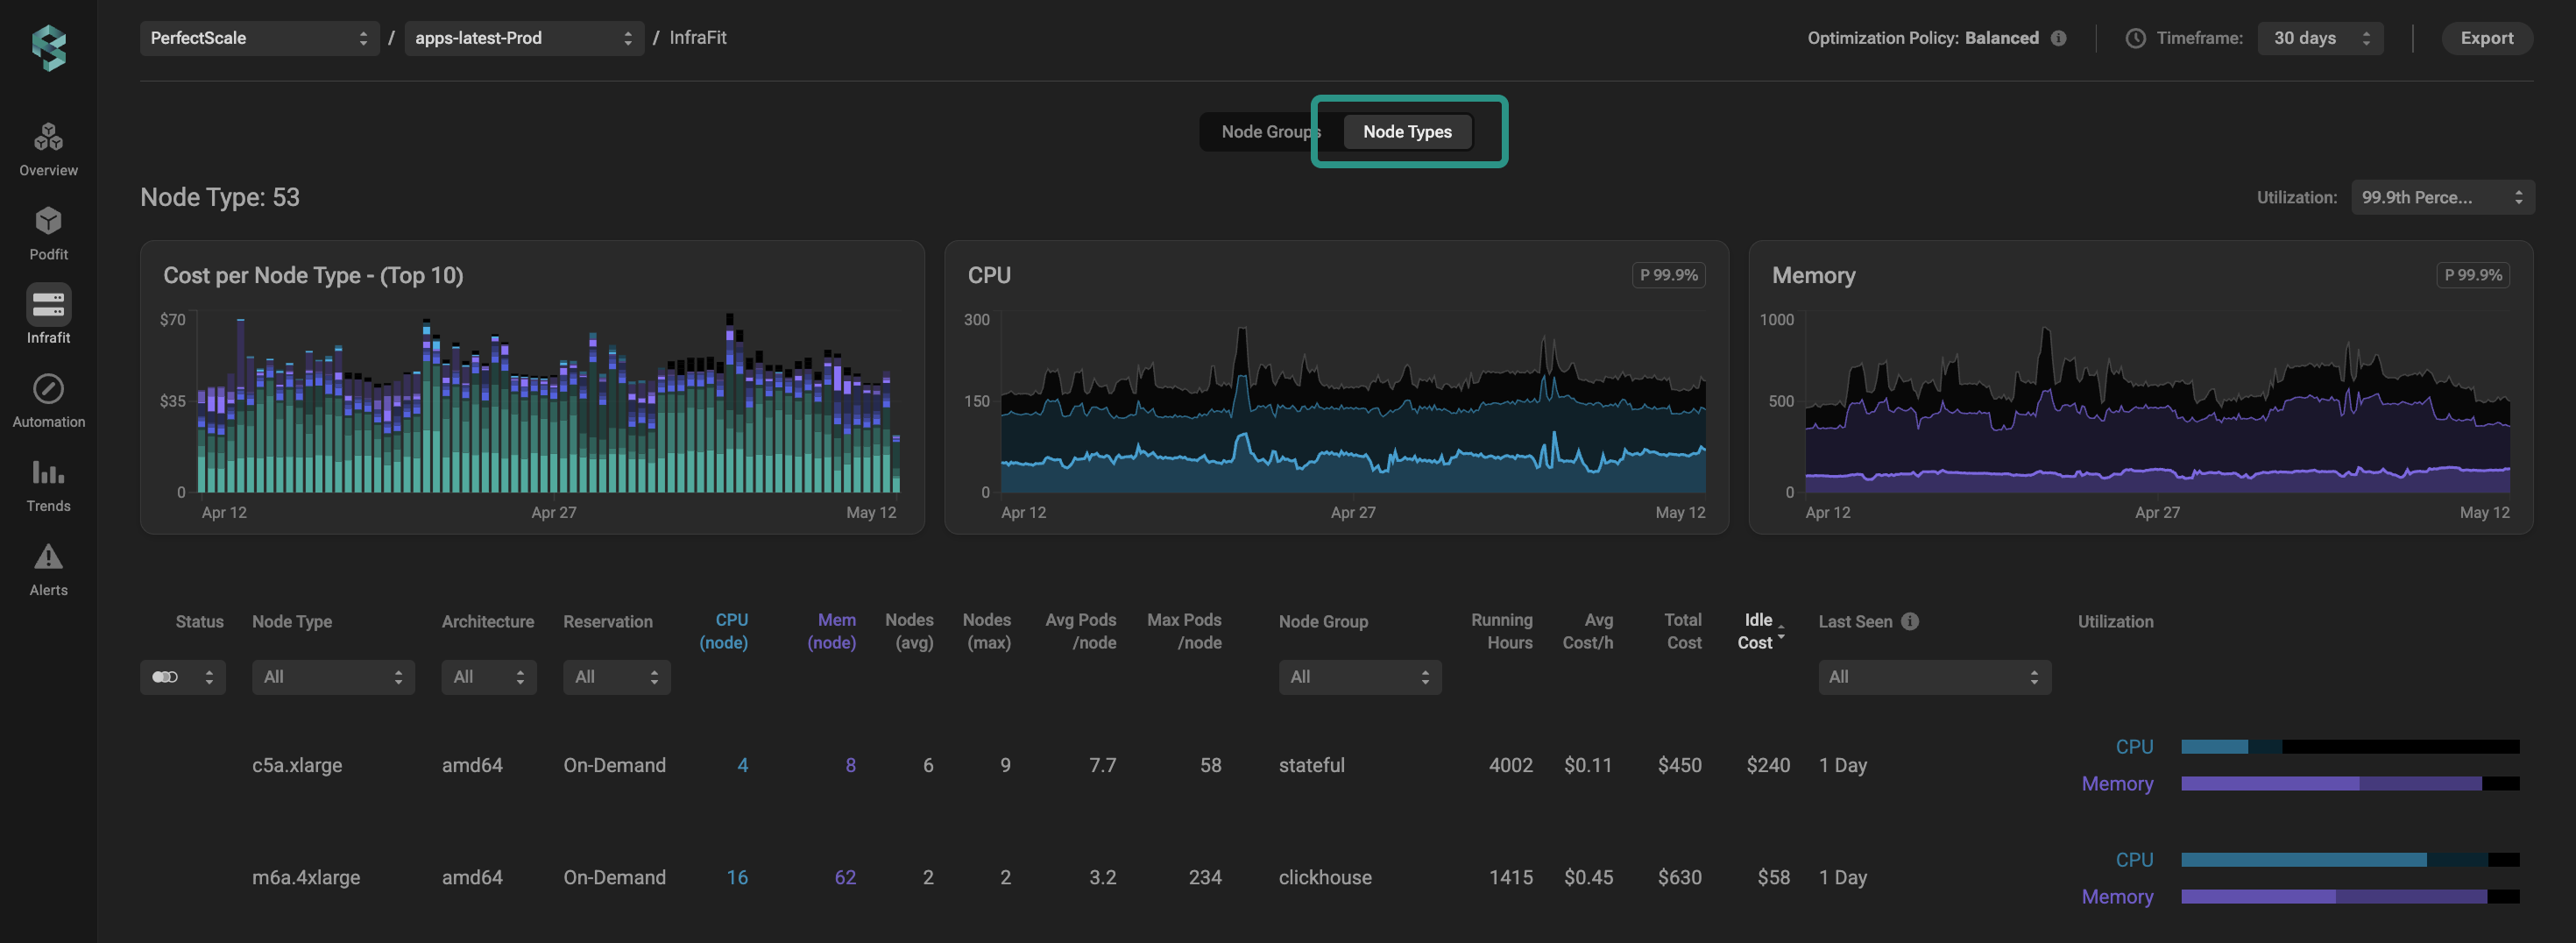
Node type view
| Column | Descripti |
|---|---|
| Node Type | Displays the Instance Type Name. Click on a column title or use a drop-down list to sort or filter data. |
| Architecture | Displays the Node Architecture. Click on a column title or use a drop-down list to sort or filter data. |
| Reservation | Display the reservation type of nodes. Click on a column title or use a drop-down list to sort or filter data. |
| CPU/Mem (node) | Refers to the size of the instance type (memory and CPU). |
| Nodes (avg & max) | Displays the average and maximum number of nodes with the specific instance type. Click on a column title to sort data. |
| Avg Pods/node | Current average number of pods per the node in the node group. |
| Max Pods/node | The maximum possible pods that can be scheduled on the node. |
| Node Group | Displays which group nodes with a specific instance type belong to. Click on a column title or use a drop-down list to sort or filter data. |
| Running Hours | Displays the total instance running hours. |
| Avg Cost/h | Displays the average cost per hour of the instance with the specific type. Click on a column title to sort data. |
| Total Cost | Displays the total cost of nodes with the specific type. Click on a column title to sort data. |
| Idle Cost | Displays the cost of the space in nodes with the specific types that has never been used. Click on a column title to sort the data. |
| Last Seen | Displays the last time PerfectScale observed the node with the specific instance type. |
| Utilization | A visual representation of CPU and Memory Utilization (allocation, request, and usage) based on the selected usage percentile. Use a drop-down list to filter data with the needed value. Clicking on a specific node type will navigate you to the workloads table, displaying the workloads associated with that node type. |