Podfit | vertical pod right-sizing — Self-hosted 2.0
PerfectScale Podfit provides comprehensive insights into the health and costs of your cluster and its components, helping you quickly pinpoint areas requiring attention along with data-driven, actionable recommendations to streamline and enhance your optimization process.
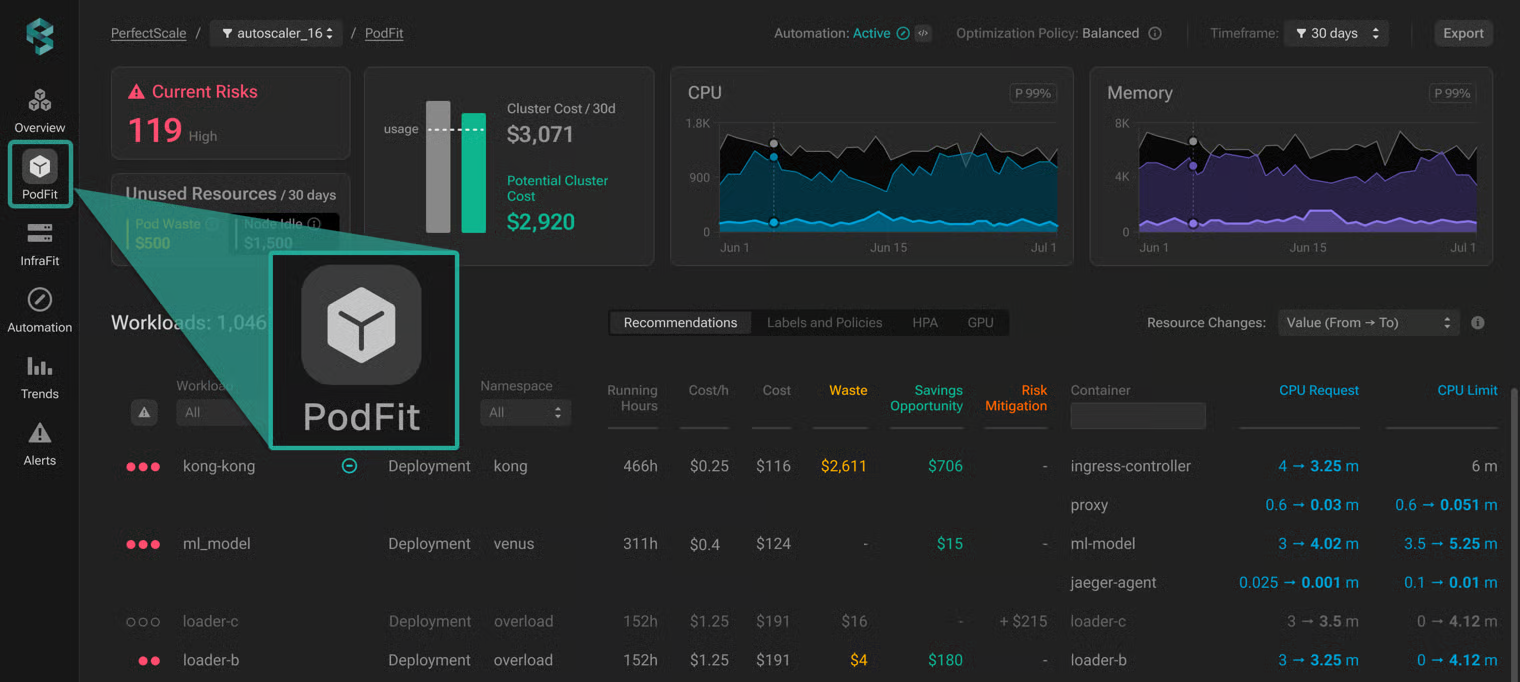
Podfit screen
Cluster overview and telemetry
The overview and telemetry section delivers a comprehensive summary of performance risks, costs, and waste insights for the selected cluster, along with identified optimization opportunities you can quickly achieve with PerfectScale. This view enables a quick evaluation of your cluster's overall health and efficiency, pinpointing configuration issues and empowering you to streamline and enhance your optimization process effectively.
Overview section

Podfit overview
Cluster selector allows for dynamic switching between clusters, enabling seamless management and monitoring of multi-cluster environment.
Tenant - the account name (PerfectScale in the example above).
Optimization Policy - displays the optimization policy of the selected cluster. Optimization Policy allows you to specify how your resources should be allocated in order to support the individual needs of your workloads. Define the policies that best suit your environment and business goals, depending on whether you want to maximize cost savings or provide extra headroom to maintain the resilience of mission-critical services.
- MaxSavings - maximum cost savings, the best for non-production environments
- Balanced (default) - optimally balances cost and resiliency
- ExtraHeadroom - the best fit for latency-sensitive environments
- MaxHeadroom - keeps the environment above the highest spikes
If a policy is set through the exporter when installing the PerfectScale Agent, it cannot be modified in the UI afterward. You can still change the policy by upgrading the exporter with the new value, or you can return it to the default by upgrading the exporter without specifying any value (this will also enable the option to change the custom time window through the UI).
Timeframe allows you to adjust the period for reviewing metrics, enabling a focused analysis for a specific time range.
Export allows you to easily download your data as a .csv file, enabling smooth analysis and effortless sharing.
Telemetry section
The telemetry section provides a comprehensive overview of aggregated data for the selected cluster, offering key insights into the cluster's health and efficiency. This helps you evaluate the cluster's performance easily and identifies opportunities for optimization, giving you a clear view of its overall status.

Podfit telemetry section
Current Risks shows the total risks identified within the cluster for the selected period. This value is dynamic and updates based on the filters applied in the workload table.
Unused Resources provides insights into the resources within the cluster that are not being effectively utilized:
- Pod Waste displays the total cost of wasted resources within the cluster. Clicking on this metric will direct you to the workload waste report, offering a detailed visual breakdown of the workloads contributing to the waste. This allows you to quickly identify the most impactful areas requiring attention, enabling more efficient optimization.
- Node Idle indicates the total cost of unutilized node space. By clicking on this metric, you'll be navigated to a comprehensive view of the cluster at the infrastructure level. This view provides valuable insights into the behavior of different node groups and types, enabling you to optimize the underlying infrastructure for your workloads effectively.
Cost & Expected Optimized Cost is a powerful widget that offers insights into the total costs incurred compared to the actual resource utilization. This information helps you evaluate whether the cluster is well-balanced, over-provisioned, or under-provisioned. Additionally, the widget provides a Recommended Cost, reflecting the potential savings achievable through PerfectScale's recommendations, ensuring your cluster operates efficiently and cost-effectively. Clicking on this metric will direct you to the cluster cost report for further investigation.
Negative savings indicate an under-provisioned environment.
CPU/Memory Utilization Over Time provides a comprehensive visual representation of resource allocation, requests, and usage trends within your cluster. Tracking these metrics over a specified timeframe allows you to analyze historical data to understand how resource dynamics have changed, compare actual usage with allocated and requested resources, and identify utilization patterns.
- Used - p99 of utilization
- Requested - p99 of combined requests of all the workloads
- Allocated - p99 of available cluster compute
Workloads table
The Workload table provides a detailed overview of all the workloads running in your cluster. Each row represents a specific workload and its containers, including critical metrics like cost, waste, and potential cost increase due to under-provisioned resources. This view will help you quickly identify workloads that are misaligned with resource demands, highlighting optimization opportunities and areas at risk that require attention. With dynamic filtering and sorting options, you can easily focus on specific namespaces, labels, or workloads, making it easier to prioritize optimization tasks and run clusters efficiently.
Workloads are sets of pods of a
Deployment,StatefulSet,DaemonSet,Job,or custom resource CRD (for example -Runner,SparkJob,etc)
Hover over the column name to view hints.
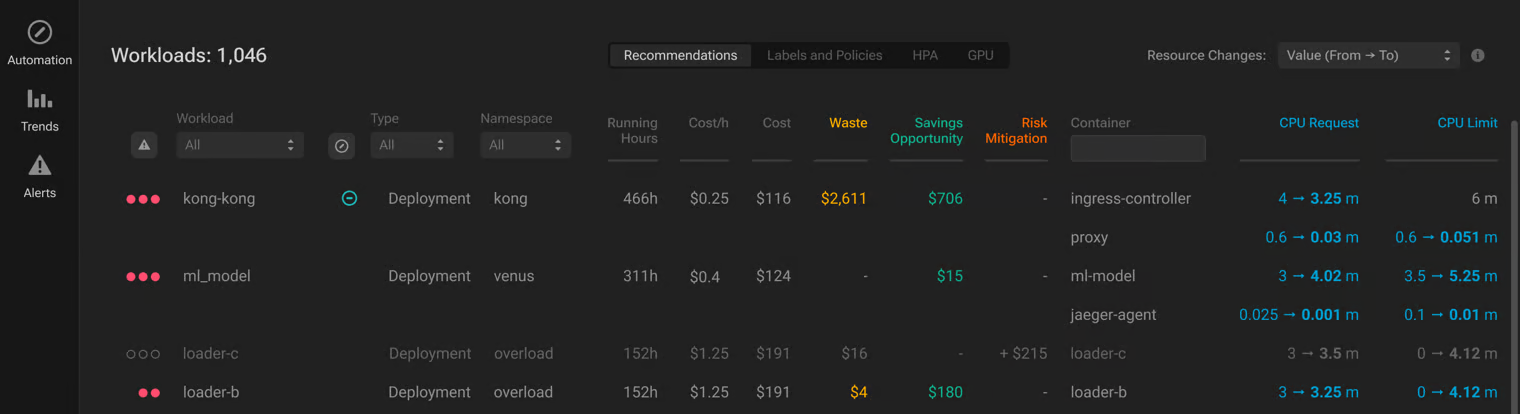
Workloads table
Filtering resiliency issues
Status indicates workloads at risk. Workloads could be easily filtered by the resiliency risk level or particular indicator.
Risk indicators are dynamic, i.e., the presence of OOM indicator in the list means that at least one workload experienced an out-of-memory event in a given timeframe.
The dot count is a visual indicator of risk levels, with three levels: Low, Medium, and High (three dots represent the High-risk level).
Hollow dots indicate a muted workload, while shaded dots indicate the presence of a workflow ticket in progress.
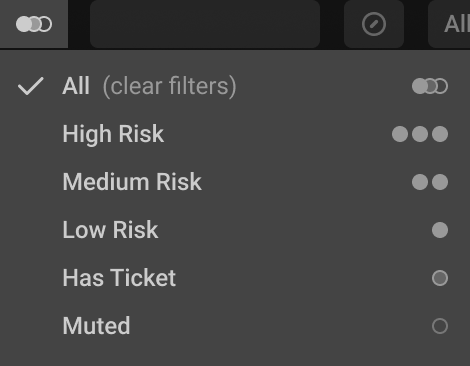
Status
Automation status
This column shows the current automation status of each workload. You can quickly filter the data by automation status, prioritizing and focusing on the most relevant workloads for further investigation.
Multiselect is available.
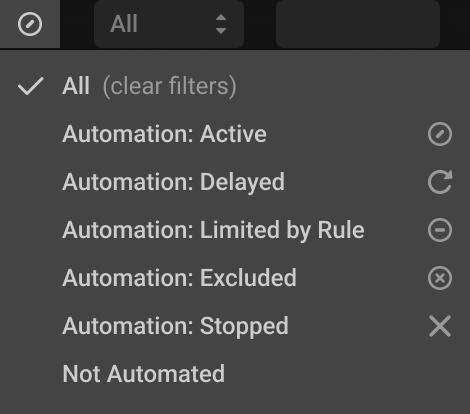
Automation status
| Status | I | Description |
|---|---|---|
| Active |  | Once the configuration is completed, automation will be indicated as successfully enabled. |
| Limited by Rule |  | Indicates that automation is intentionally restricted by a specific rule. Learn more about resource allocation constraints here. |
| Delayed |  | If the defined CRD maintenance window causes time constraints, the execution of recommendations will be postponed. |
| Disabled |  | The merged CRD will disable automation for the workload. For example, if the cluster-level configuration enables automation while the namespace-level configuration disables it, the namespace-level configuration takes precedence, resulting in disabled automation for the particular workloads within the cluster. |
| Stopped |  | PerfectScale will forcibly stop the automation. For example, to prevent your environment from recursive resource increases, such as those resulting from memory leaks. |
Type
This column identifies the workload type (e.g., Deployment, StatefulSet). You can use filtering, sorting, and multi-select options to tailor the data display, making focusing on specific workload types easier.
Namespace
The namespace column shows the namespace of each workload. You can apply filtering, sorting, and multi-select options to customize the data display, allowing you to focus on specific namespaces.
If PerfectScale does not detect any workload in the Namespaces for 7 consecutive days, those Namespaces will be consolidated into a separate Namespace __deleted-namespaces__.
Running Hours
The workload running hours column indicates the total duration each workload, including its replicas, has been actively running in the cluster during the selected period. You can use the sorting option to arrange the data in your preferred order.
Cost/h
The workload cost per hour column indicates the total hourly expense of the workload. You can use the sorting option to arrange the data in your preferred order.
Cost
The workload total cost column shows the total expense of the workload for the selected period, considering both its hourly cost and the duration it has been actively running. You can easily identify the most costly workloads in the cluster with a single click using the sorting option.
Waste
The workload waste column indicates the historical waste caused by over-provisioned resources allocated to a workload. You can easily identify the most wasteful workloads in the cluster with a single click using the sorting option.
Savings Opportunity
The savings opportunity displays the expected total savings achievable by applying data-driven workload right-sizing recommendations.
Risk Mitigation
The risk mitigation column shows the projected rise in workload cost based on PerfectScale’s recommendations, indicating that the workload is under-provisioned. This helps you predict the cost adjustments required to maintain cluster stability.
Container
The container column lists the containers associated with each workload. You can use filtering options to display the data for a specific container(s). Multi-select is available.
View Customization
Easily jump between Recommendations, Labels and Policies, and HPA views using the switcher above the table.
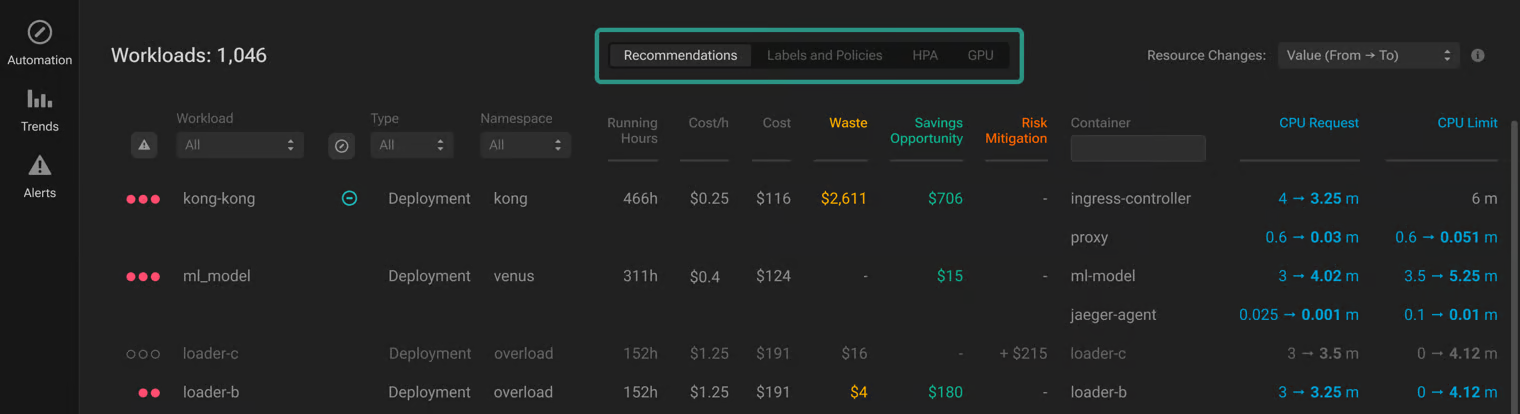
Podfit view customization
Recommendations view
The Recommendations Table offers clear insights into necessary workload resource adjustments to maintain the cluster's stability and cost efficiency. To access more information, click on the workload. This will open up a Zoom-in window that provides a comprehensive breakdown.
| Name | Description |
|---|---|
CPU Request | PerfectScale guidelines for CPU Request. |
CPU Limit | PerfectScale guidelines for CPU Limit. |
Memory Request | PerfectScale guidelines for Memory Request. |
Memory Limit | PerfectScale guidelines for Memory Limit. |
If one or more resources have reached their CRD-defined size constraints, the recommendations will not be executed. In this case, the Limited by Rule indicator, along with an explanatory tooltip, will be displayed near the recommendations.
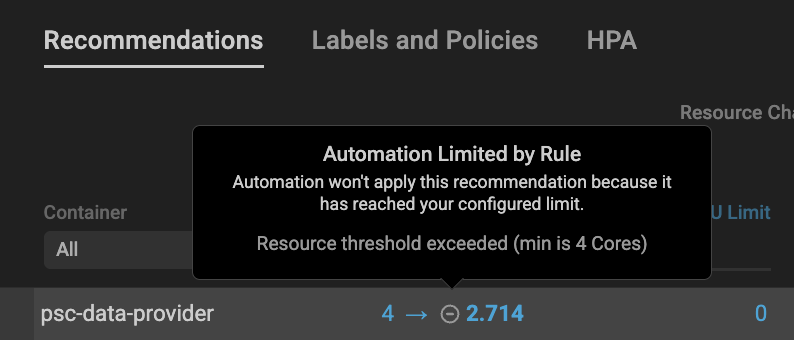
Learn more about resource allocation constraints here.
To customize your recommendations view, use the Resource Change View drop-down menu.
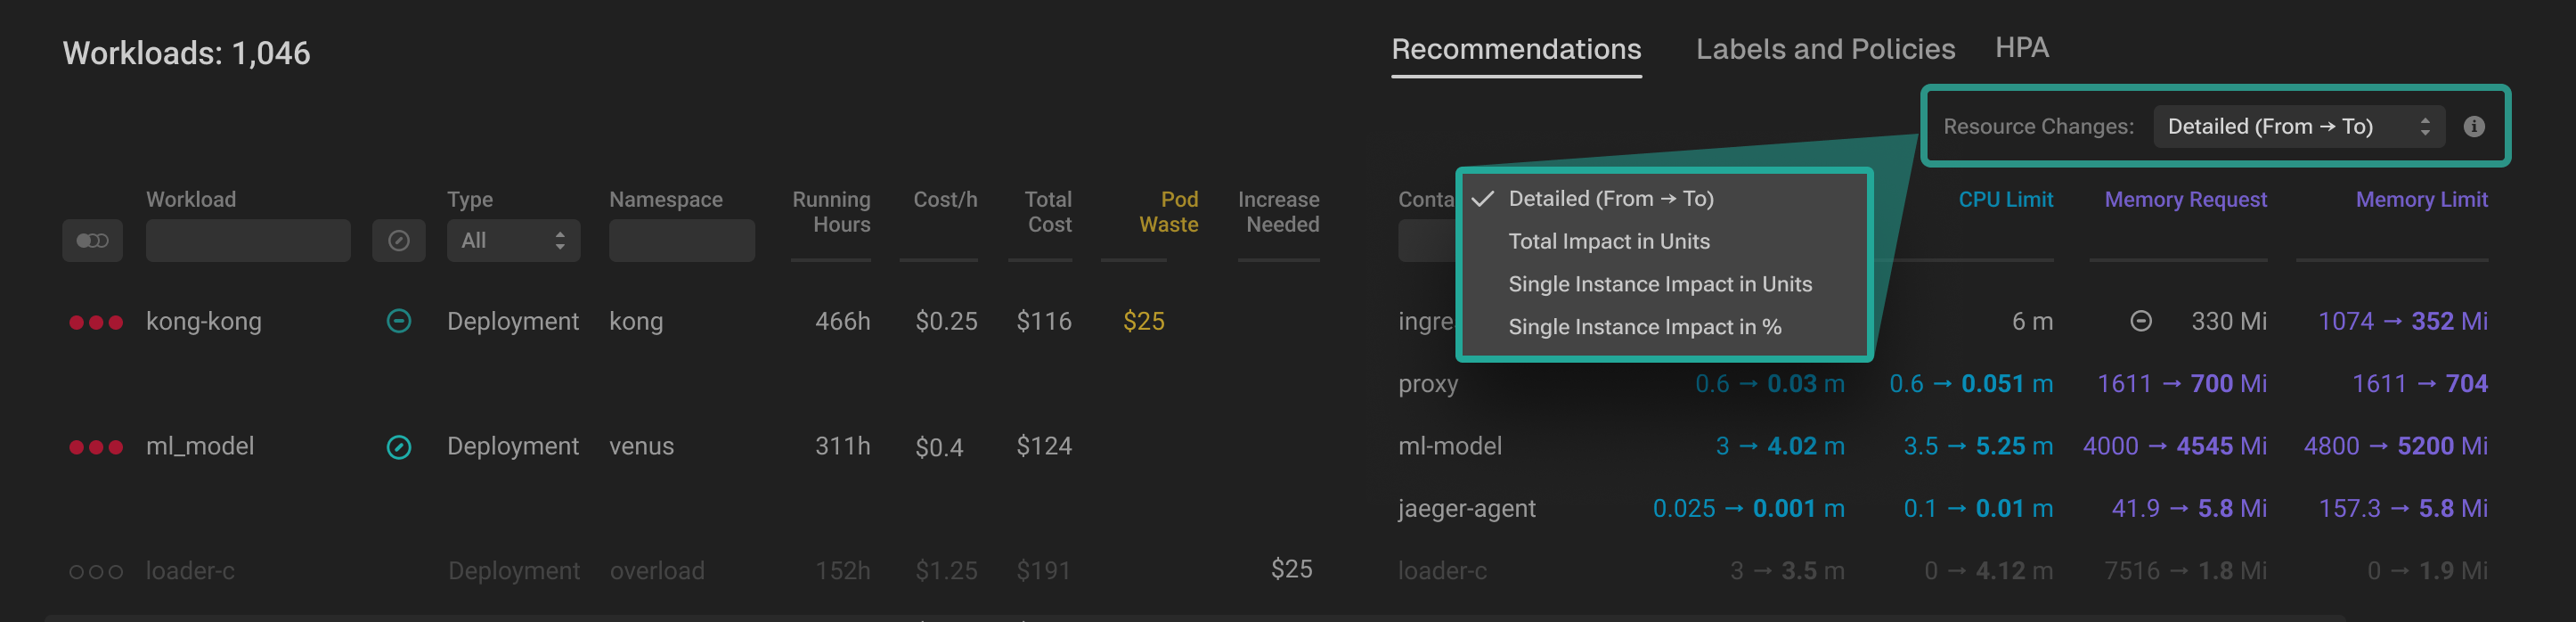
Recommendations formats
- Detailed - to display the changes made to resources (shows both the previous and new values).
- Total Impact in Units - to display changes made to resources as an absolute number, factoring in replica count.
- Single Instance Impact in Units - to display changes made to resources as an absolute number.
- Single Instance Impact in % - to display changes made to resources in a percentage format.
When the recommendation view is set to Total Impact in Units, the resource change impact summary is available. This view provides a clear understanding of the effect of total resource adjustments, enabling seamless evaluation of the optimization process.

Resource change summary
Labels and Policies view
Using your existing labels can help you manage the workloads more effectively by allowing you to focus on the most important ones.
PerfectScale collects and supports Workloads and Namespaces labels.
To customize the Labels View, PerfectScale allows you to choose two label keys. Each column in the Labels Table corresponds to a selected key and displays its relevant data for each workload.
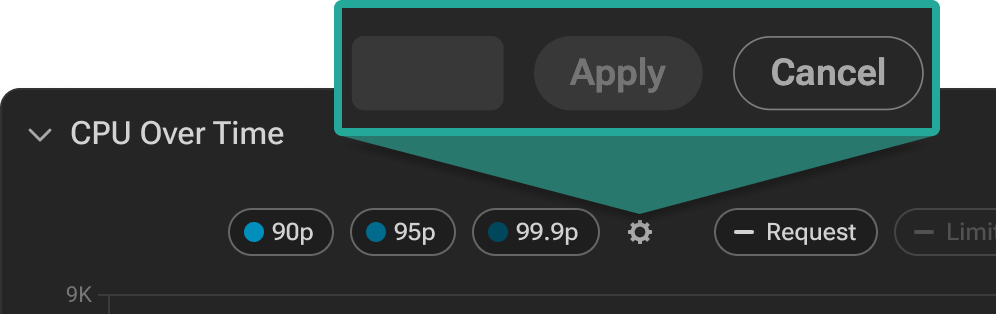
To configure the label, click on the gear button. Then, choose the desired labels to be displayed and click the Apply button. Once the changes are applied, the values that correspond to the selected keys for workloads will be displayed.
When configuring the label view, it is possible to operate with the labels of Workloads and Namespaces. All the labels appear in the same list.
The Workload labels have higher precedence than Namespace labels. If the Workload label and Namespace label have the same name, only the Workload label will be displayed.
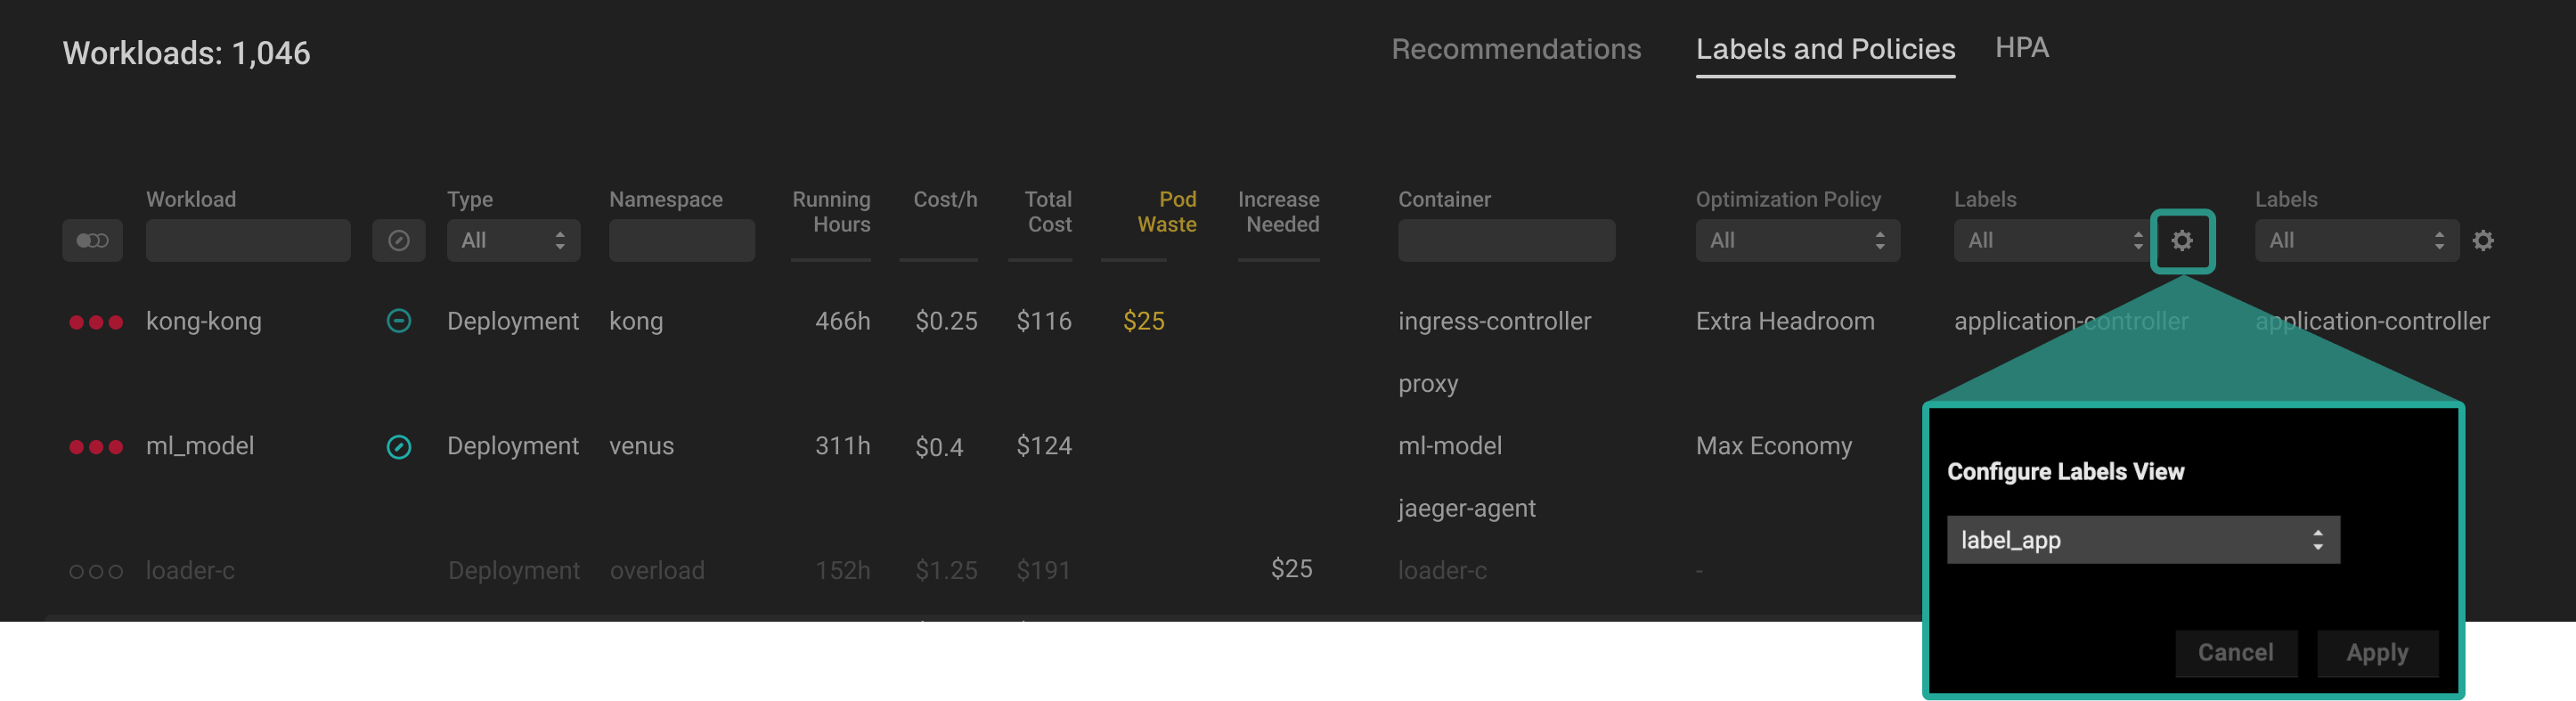
Labels view
Podfit Labels Profile enables users to create and save sets of labels, which can then be applied to clusters. The Label set listed in the Podfit Labels Profile will be applied to the clusters attached to this profile. Learn here how to configure the profile.
The Label set listed in the attached to the cluster Podfit Labels Profile takes precedence over any manually applied labels. If the cluster has a Podfit Labels Profile attached, it will always revert to its label set. However, if no such profile is attached, any manual label changes will be saved.
Optimization Policy outlines how resources should be allocated to meet the unique requirements of each workload. The Optimization Policy can be set for the entire cluster and a specific workload.
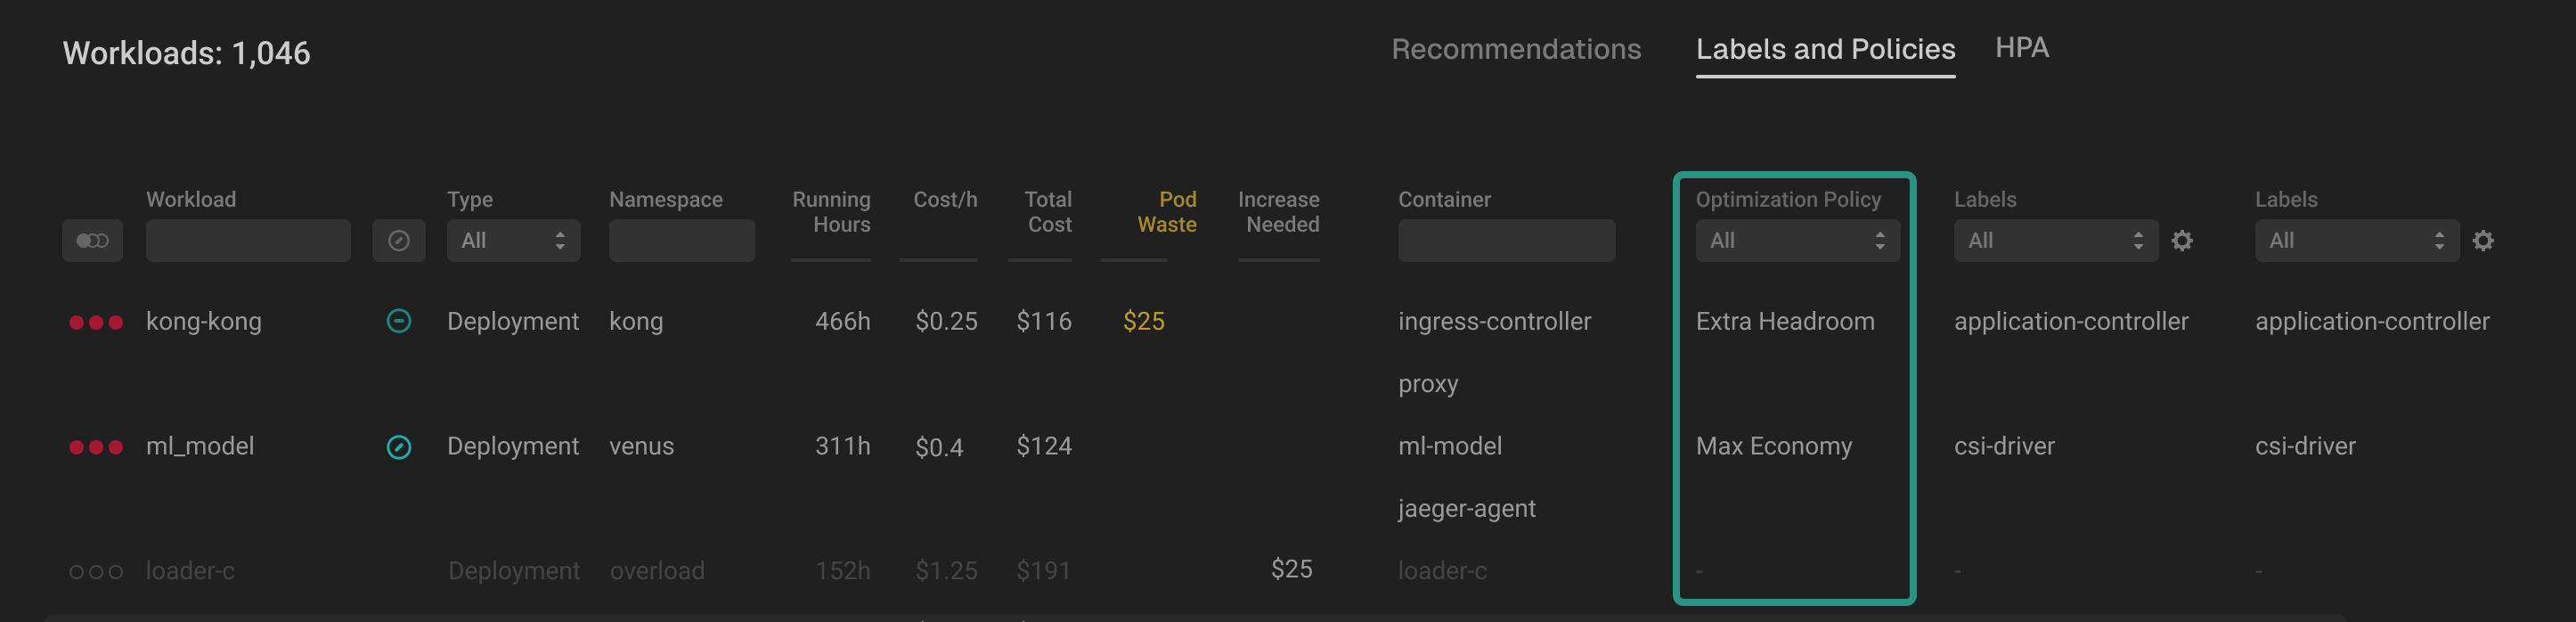
Optimization policy
HPA view
The HPA view provides a clear overview of workloads utilizing Horizontal Pod Autoscaler (HPA). This feature enables users to quickly identify the workloads where HPA has been introduced and adjust HPA thresholds with provided informative tooltips that offer tailored recommendations. These recommendations are particularly helpful in optimizing scaling decisions, minimizing resource waste, and ensuring efficient operation of workloads.
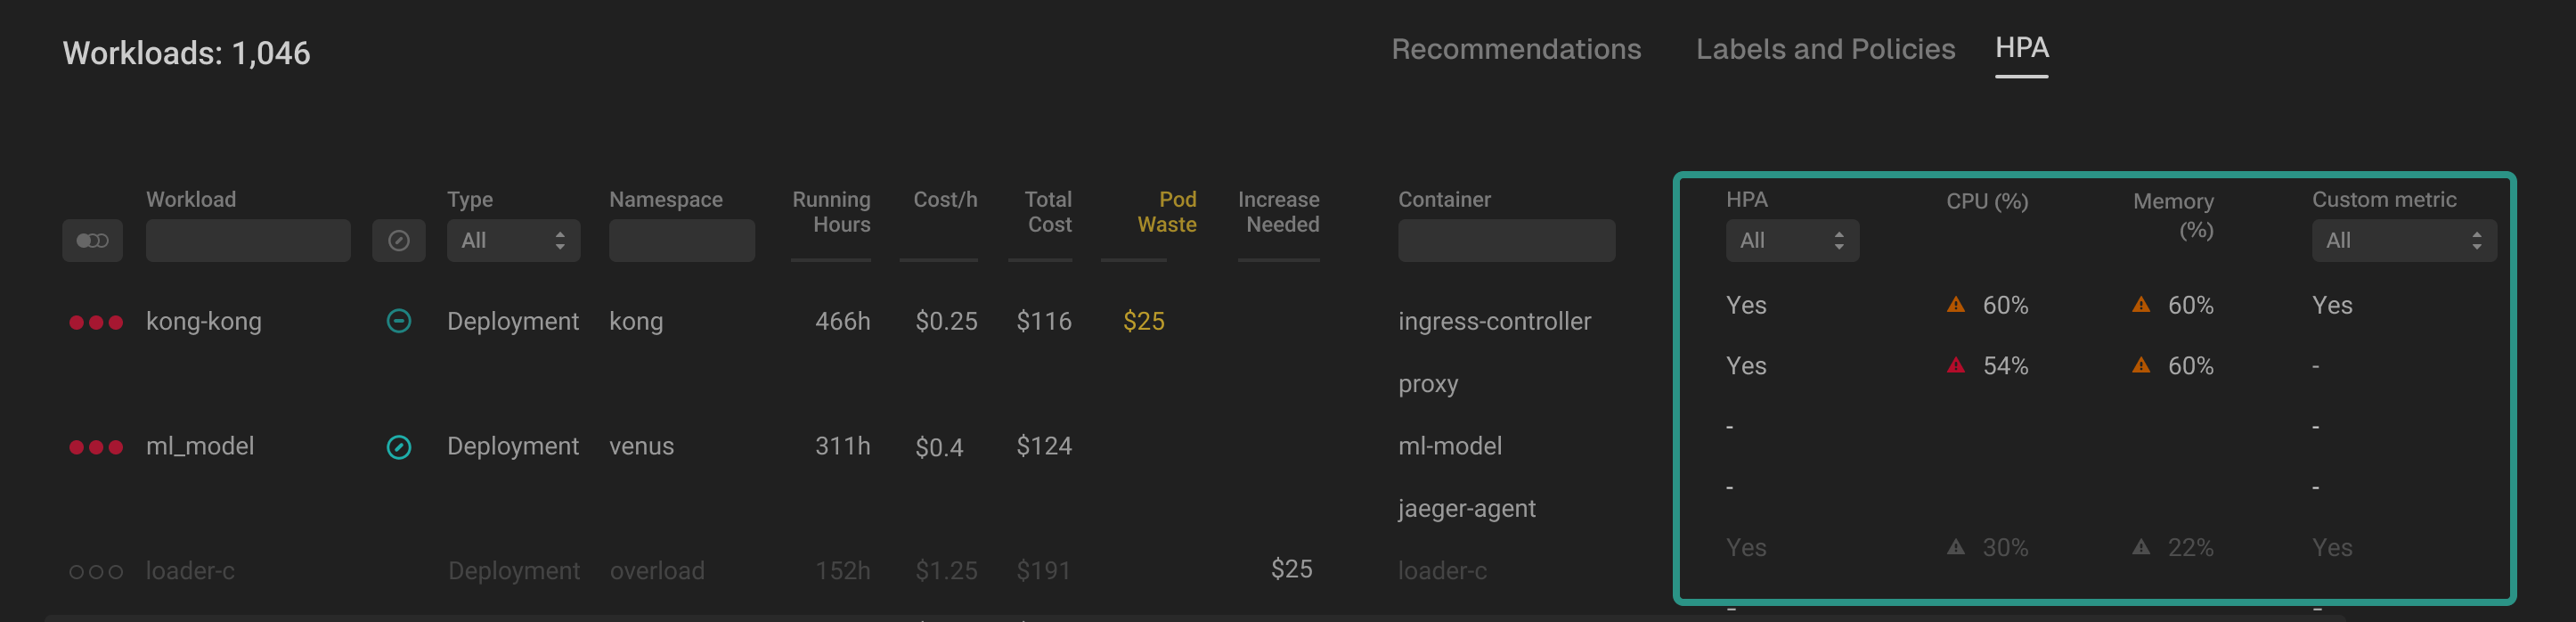
HPA view
| Column | Description |
|---|---|
| HPA | Indicates whether HPA has been introduced for the workload. You can easily sort the column by clicking the header or apply specific filters. |
| CPU (%) | Displays the trigger for HPA by CPU. For insights on threshold recommendations, simply hover over the warning tooltip. You can easily sort the column by its values by clicking the header.
|
| Memory (%) | Displays the trigger for HPA by Memory. For insights on threshold recommendations, simply hover over the warning tooltip. You can easily sort the column by its values by clicking on the header.
|
| Custom metric | Indicates whether a Custom metric has been detected. You can easily sort the column by clicking the header or apply specific filters. |
GPU view
This view delivers exceptional GPU utilization visibility to monitor and optimize GPU resources within your Kubernetes clusters, helping to identify optimization opportunities, reduce resource waste, and improve overall K8s efficiency.

GPU view
Detailed workload analysis
The zoom-in window provides comprehensive details of the workload's current state and behavior, along with historical data over time, delivering detailed metrics and unmatched visibility on resource utilization efficiency and performance risks. It provides actionable recommendations for adjusting resource allocations to enhance performance and minimize waste, and emphasizes the impact once they are implemented. Additionally, users can explore the Revision History, which displays all updates and changes, including automated or manual adjustments made to the workload, simplifying further analysis and helping track optimization progress over time.
By clicking on the workload, you will be directed to its zoom-in window:
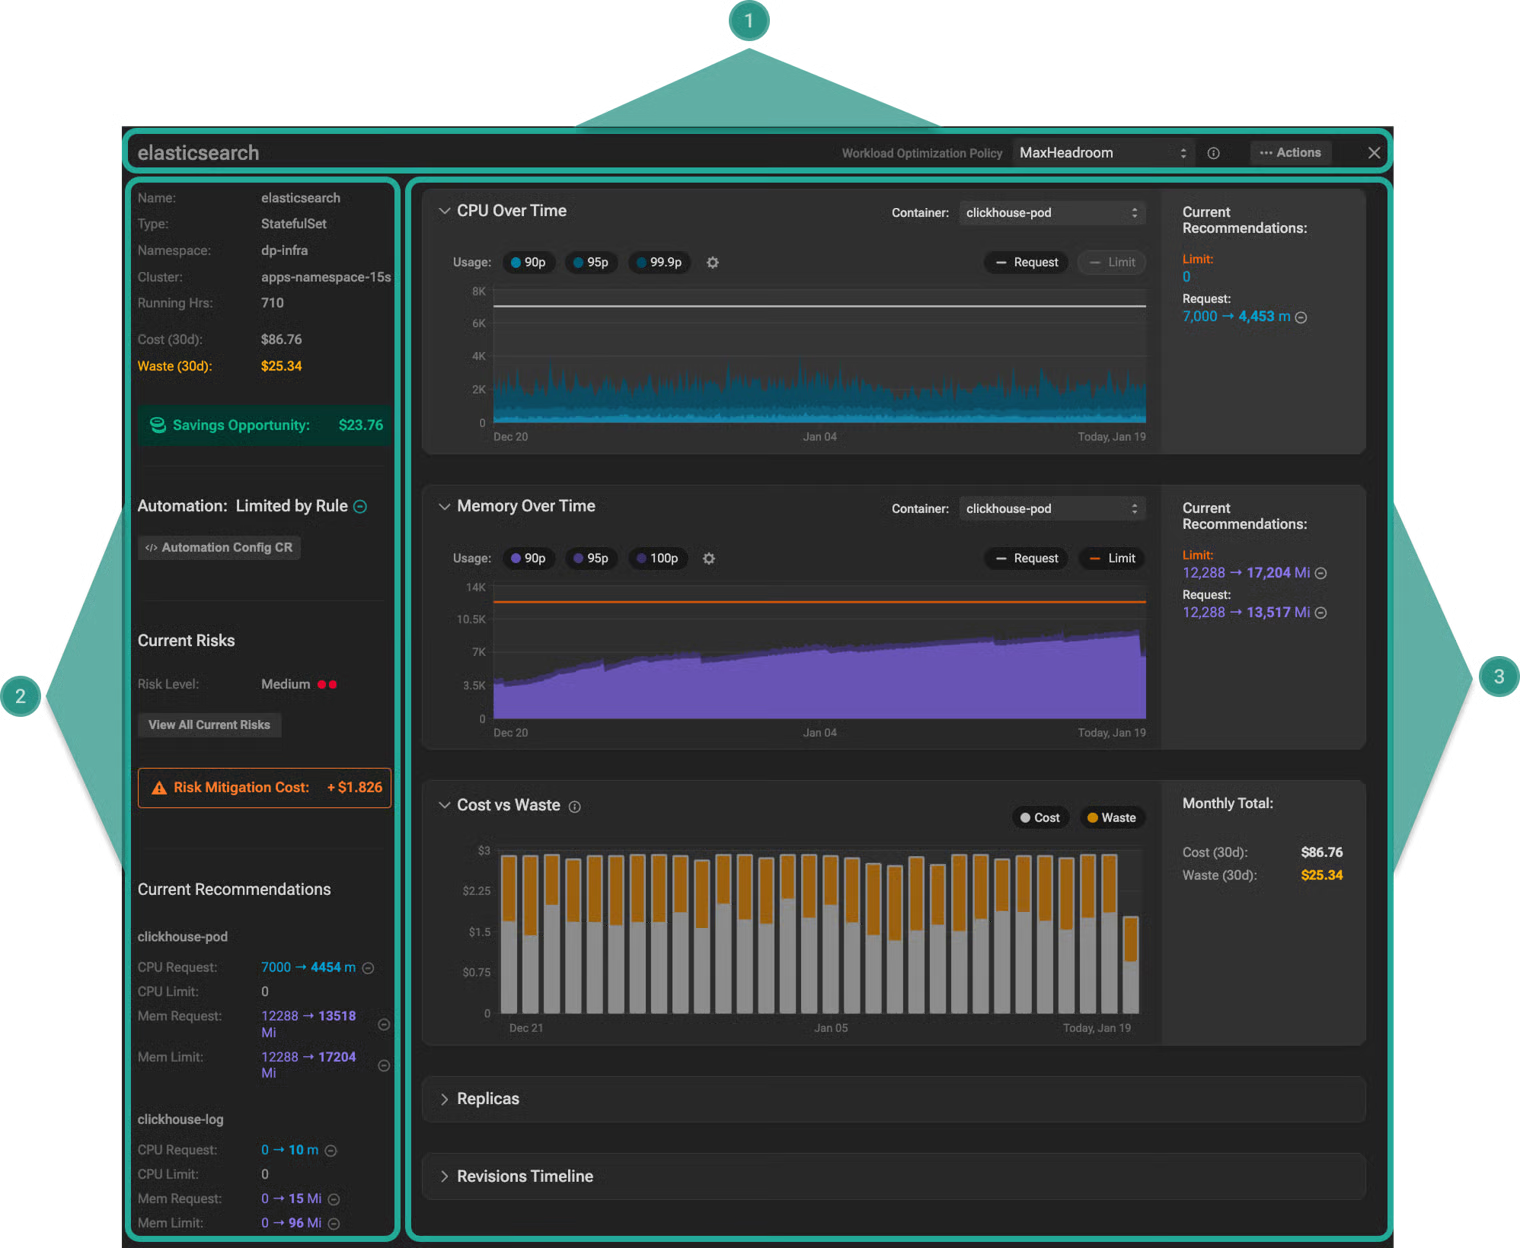
Zoom-in window
Top panel
The top panel displays the currently selected workload and offers easy access to the Workload Optimization Policy management menu as well as the actions menu.
Workload Optimization Policy
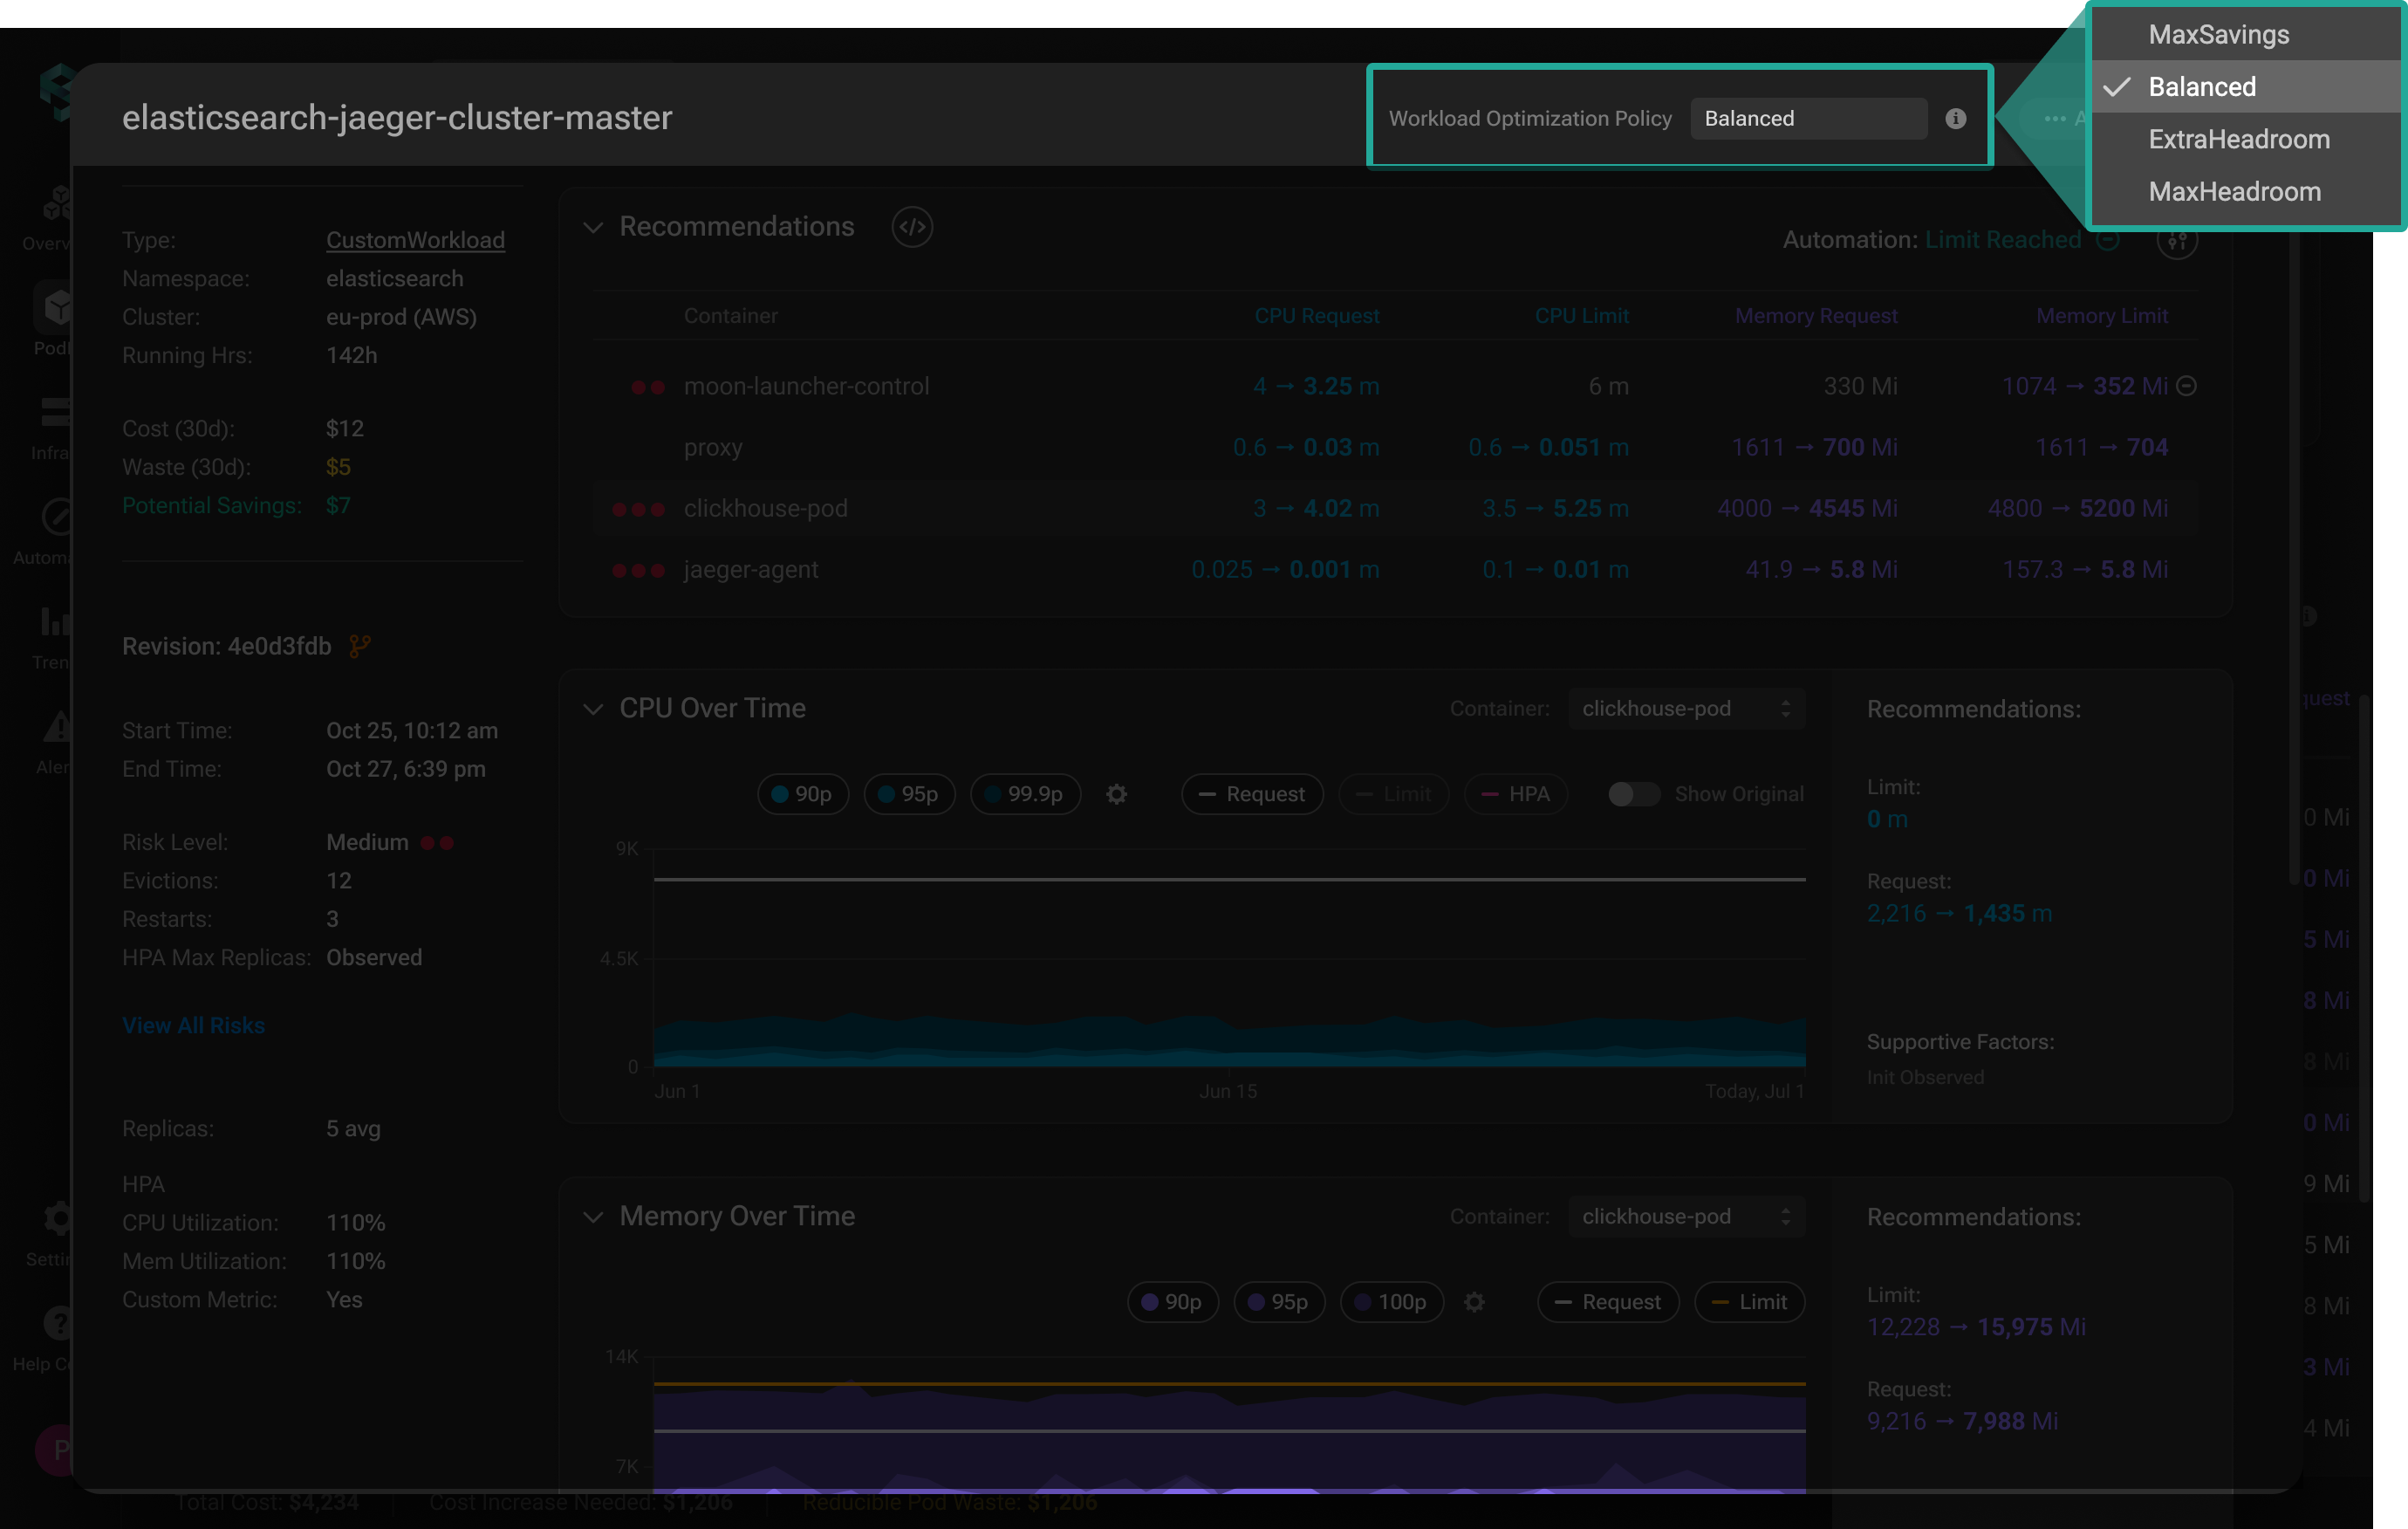
Workload optimization policy
This displays the optimization policy of the selected workload. The optimization policy specifies how resources should be allocated to achieve the desired level of resiliency and meet application demand. This ensures that your system maintains optimal performance and stability according to your predefined standards.
- MaxEconomy - the best fit for non-production environments (Low Resiliency)
- Balanced (default) - optimally balances cost and resiliency (Medium Resiliency)
- ExtraHeadroom - the best fit for latency-sensitive environments (High Resiliency)
- MaxHeadroom - keeps the environment above the highest spikes (Highest Resiliency)
Set ExtraHeadroom or MaxHeadroom Optimization Policy with just a few clicks for your mission-critical production services, ensuring continuous optimal performance.
To change the policy for the workload, select the desired one from the drop-down list and click Save button to apply the changes.
The Optimization Policy can be set for the entire cluster and for a specific workload. The workload's Optimization Policy takes precedence and will override the value defined at the cluster level. If the Optimization Policy is not specified for the workload, PerfectScale will use the default policy set for the cluster.
Actions
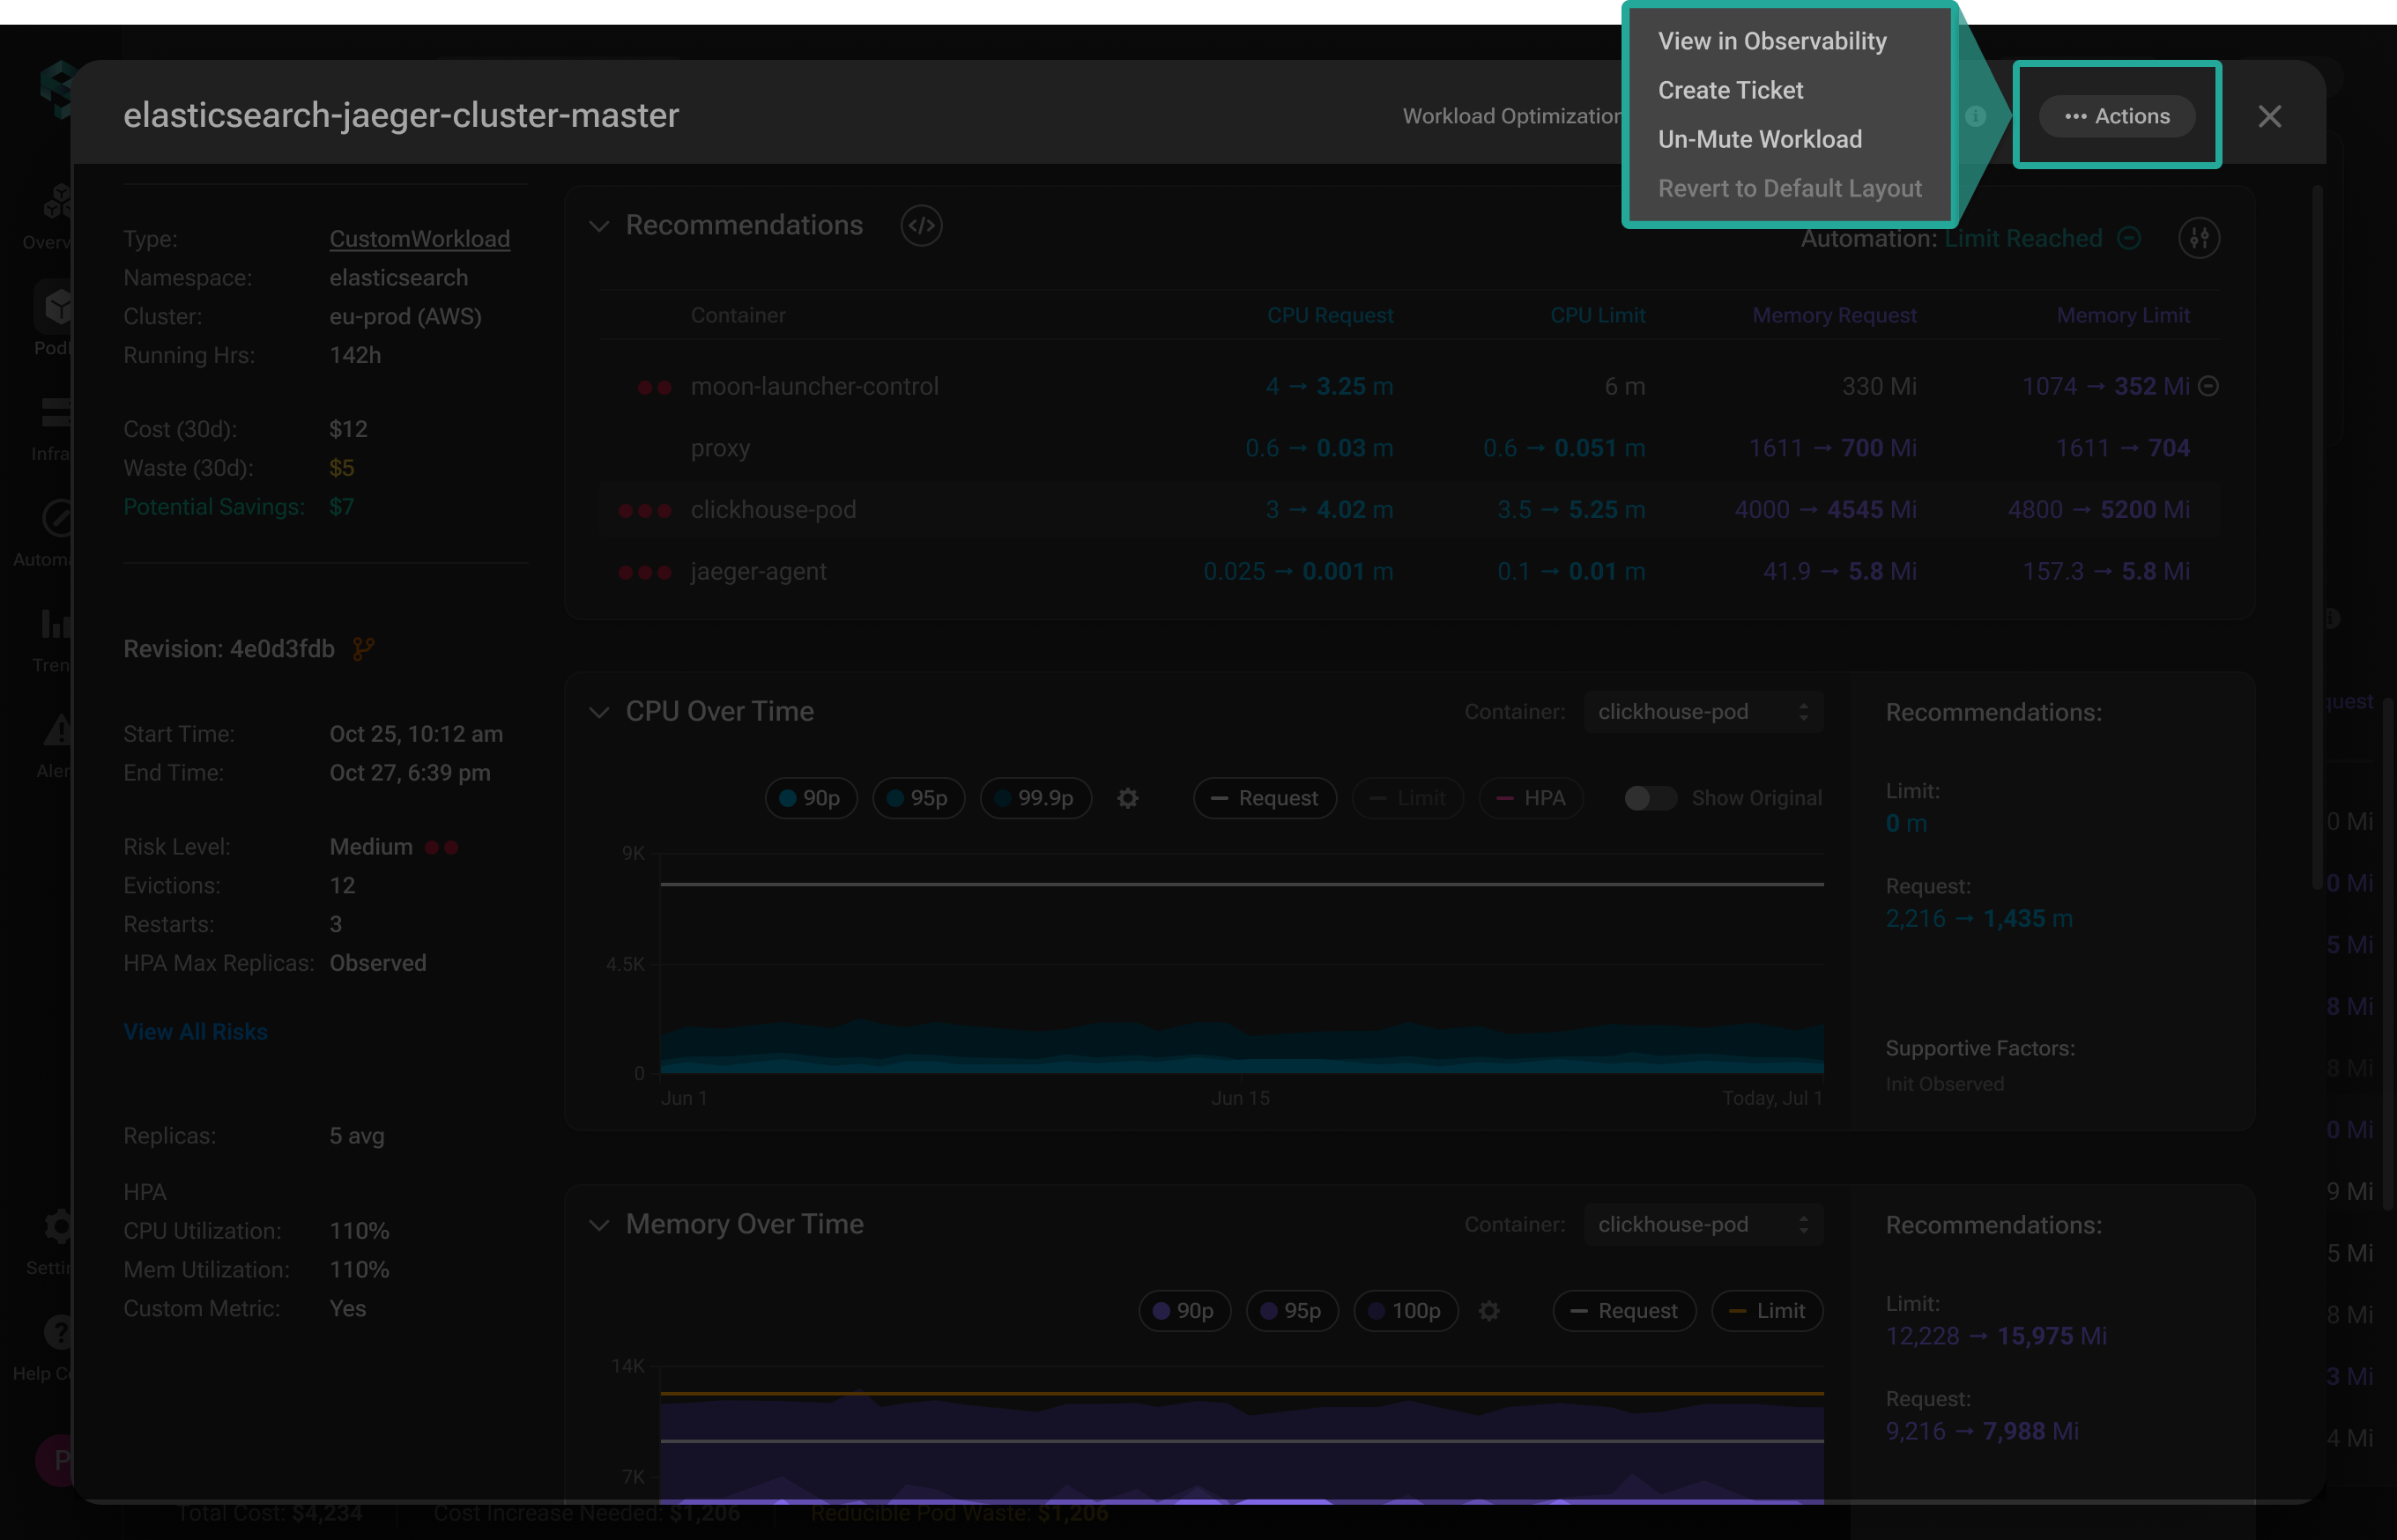
Actions
The actions menu provides quick access to various tasks for streamlined workload management.
The previous version of the Zoom-in window is accessible. To change to this version, click the Switch to Legacy UI button in the Actions menu.
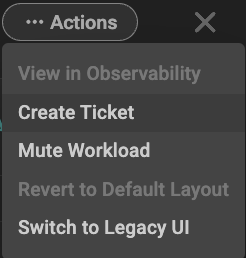
Clicking View in Observability will be directed you to the observability tool connected to the cluster. Learn more here about how to integrate your preferred observability tool and receive exceptional insights from PerfectScale directly to your dashboard.
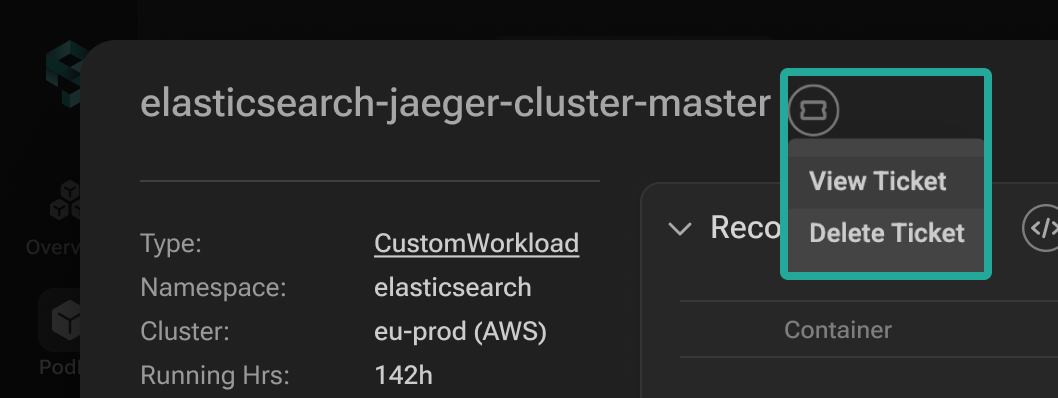
Create a ticket with all the details about needed changes in the defined project and assign it to the relevant engineer (team) automatically by clicking Create Ticket. Learn how to integrate your Jira with PerfectScale smoothly here.
If the ticket already exists, you can use one of the following options: View Task or Delete Task.
Mute Workload is a useful feature when you want to stop receiving notifications for a specific workload. By muting it, you'll no longer get alerts related to that workload, even if there’s an Alert Profile linked to it. If you want to start receiving alerts for the previously muted workload, click Un-Mute Workload in the same menu.
Muted workloads may still appear in certain metrics while being excluded from others. Check the details here.
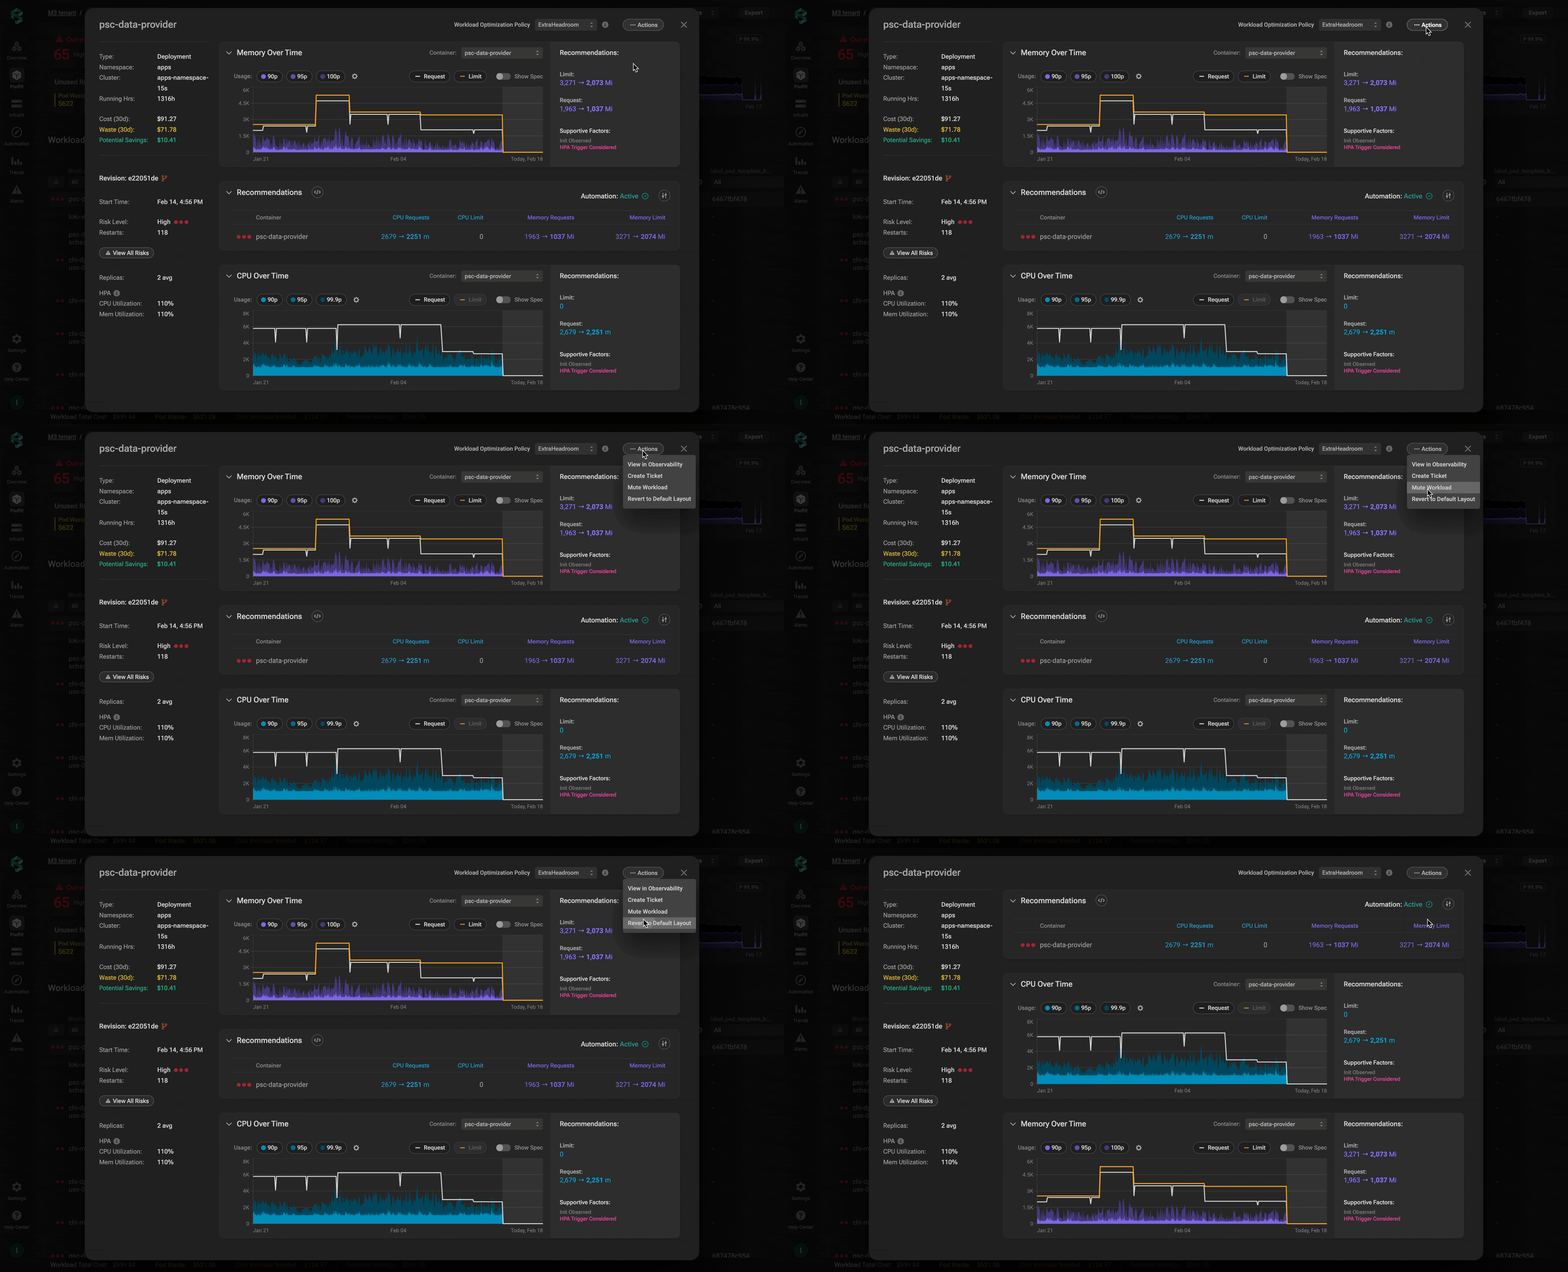
Clicking Revert to Default Layout will reset the order of the widgets in the Workload details panel.
Workload summary panel
This panel provides a comprehensive overview of key cost metrics, highlighting potential savings and identifying existing performance risks. Additionally, it shows the average number of observed workload replicas and indicates whether HPA has been introduced, along with its associated thresholds.
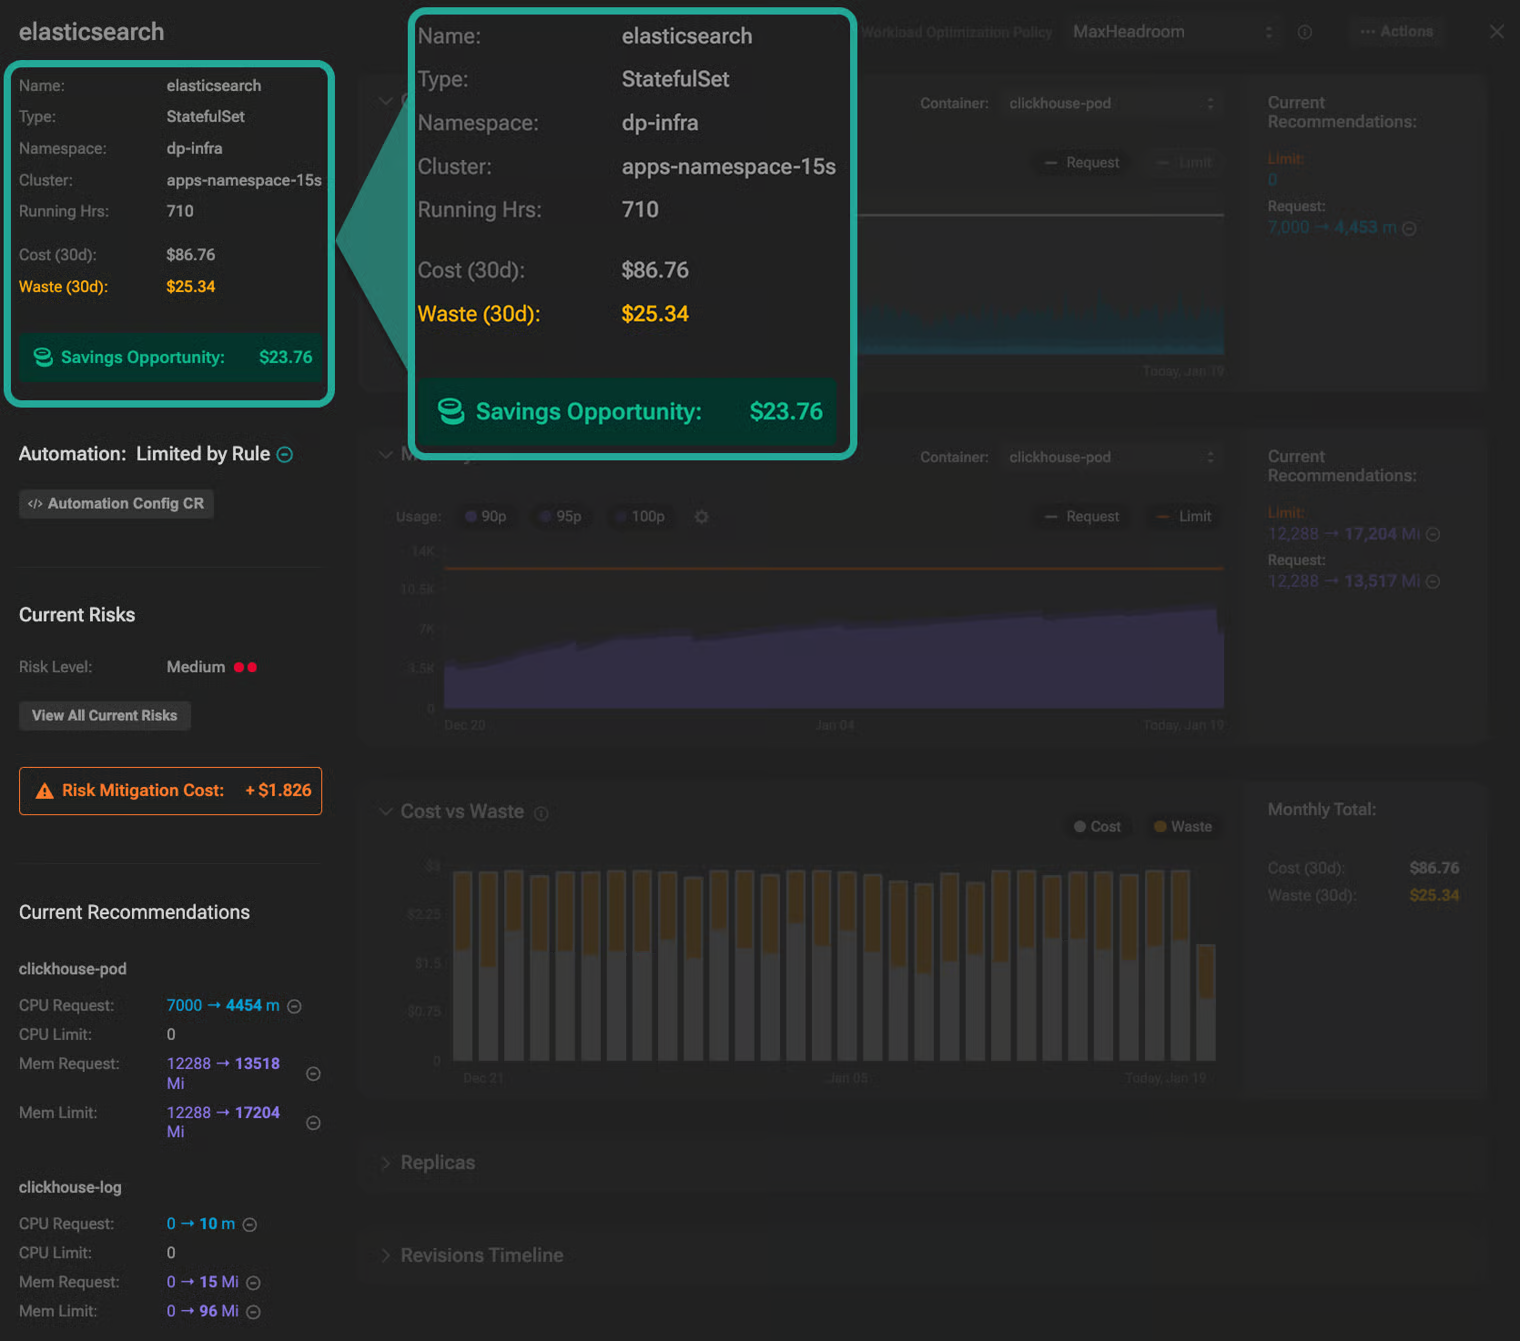
Workload summary
At the top of the panel, you can see the type of the selected workload, along with the corresponding namespace and cluster. Running hours (Running Hrs) refers to the total duration the workload, including its replicas, has been actively running in the cluster over the last 30 days.
Cost section reflects the total expenses associated with the workload over the past 30 days.
Waste section reflects the total price of unutilized resources associated with the workload over the past 30 days.
Savings opportunity section shows the reducible workload cost through PerfectScale's recommendations, all while maintaining peak performance. This section has 3 states:
- 🕑 Learning – Displayed when the maturity threshold has not yet been reached.
- :heavy_dollar_sign: Amount – Displayed when potential savings are detected (estimated savings from workload right-sizing only).
- :white_check_mark: All applied – Displayed when all recommendations have been applied, and no further cost reduction opportunities are available.
Automation status and configuration
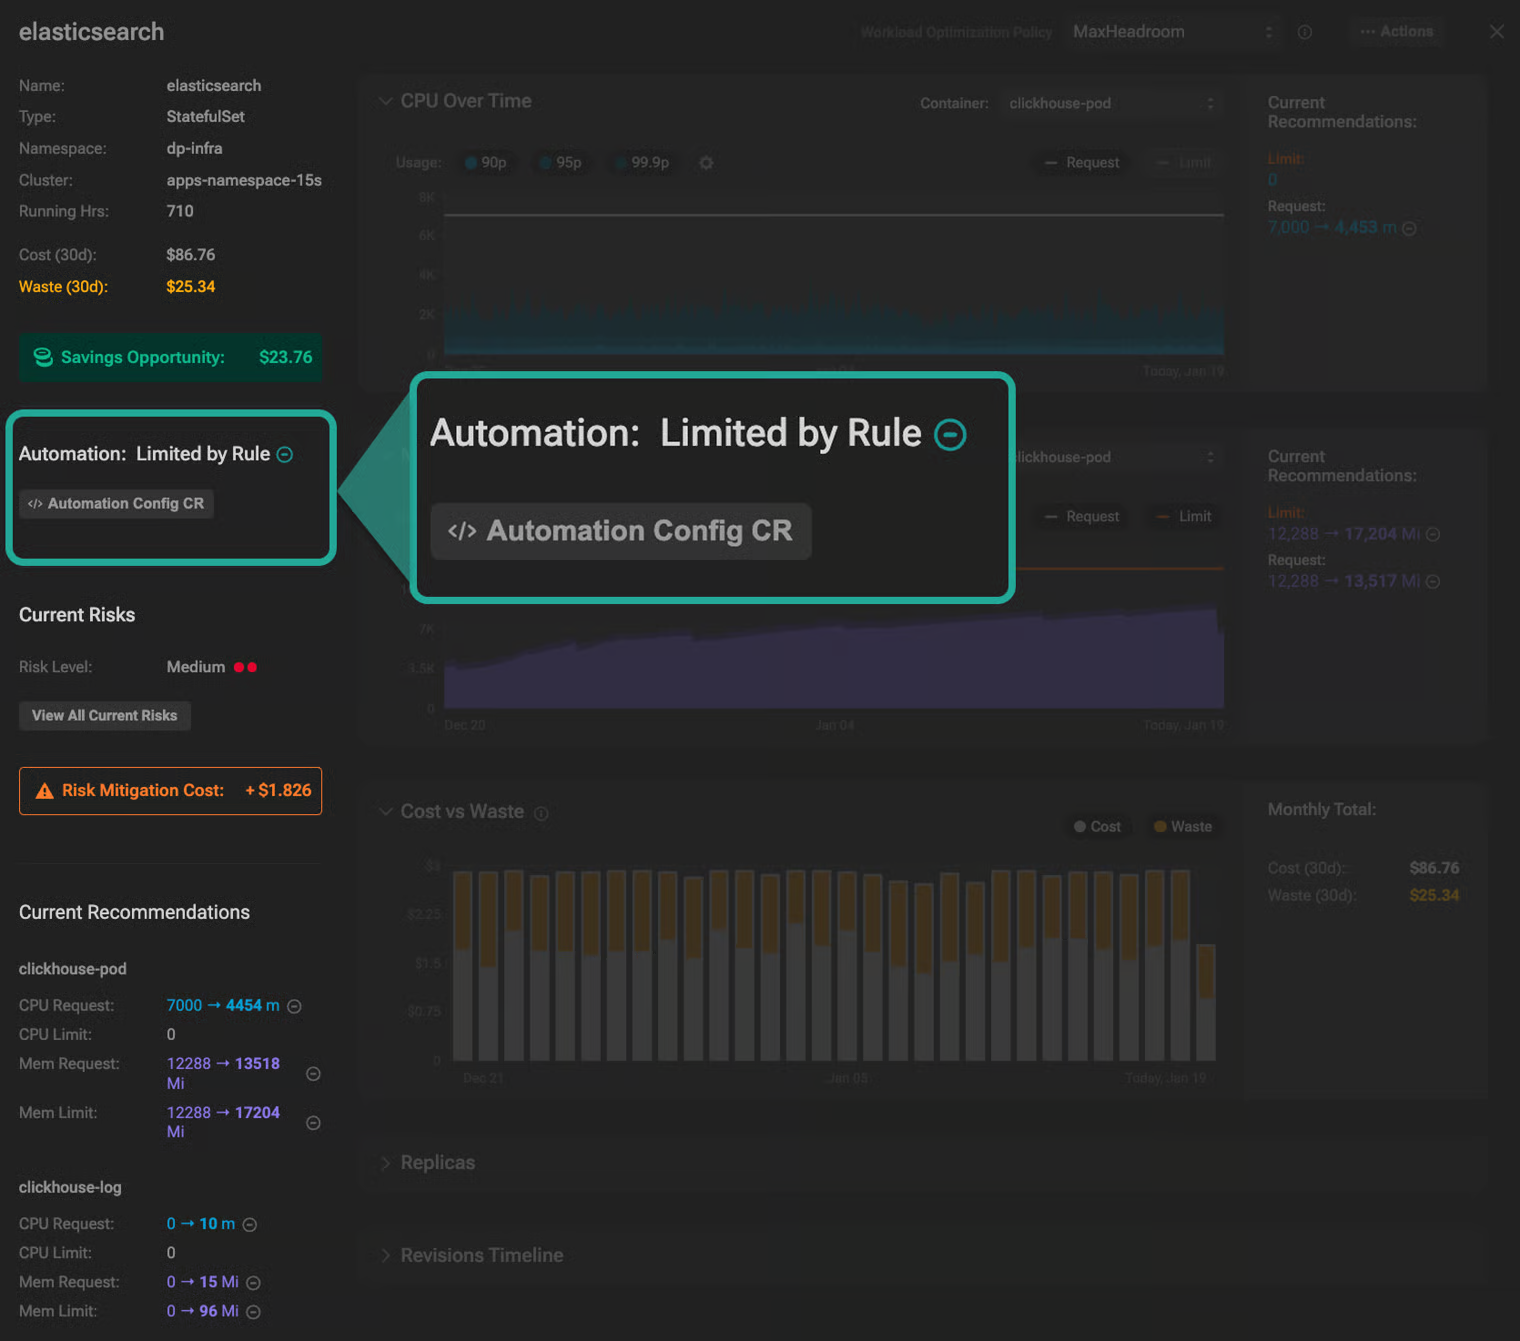
Workload automation status
The Automation section shows whether the workload is automated, displays the current Automation status (more about automation statuses), and provides easy access to the Automation Custom Resource (CR) configuration.
If the automation is not configured yet, you can seamlessly configure it. This will allow you to actively maintain your environment in prime condition and ensure peak K8s performance at minimal cost.
To get quick access to the automation configuration associated with the workload, click the Automation Config CR button.
Historical versions of specific Config CRs can be easily accessed, allowing for a comprehensive review of their changes over time.
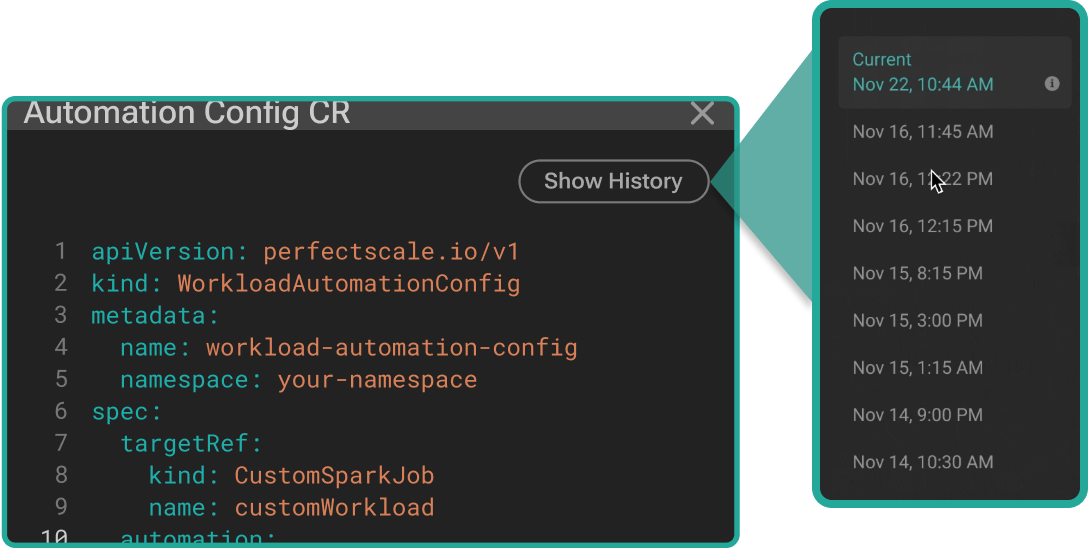
Automation CR history
Clicking Show History will open an additional panel with the list of historical CR versions, enabling you to review all the changes that were made to the CR configuration over time. Select any previous version to preview it with highlighted changes, showing the differences between the selected version and the current one.
Risks breakdown
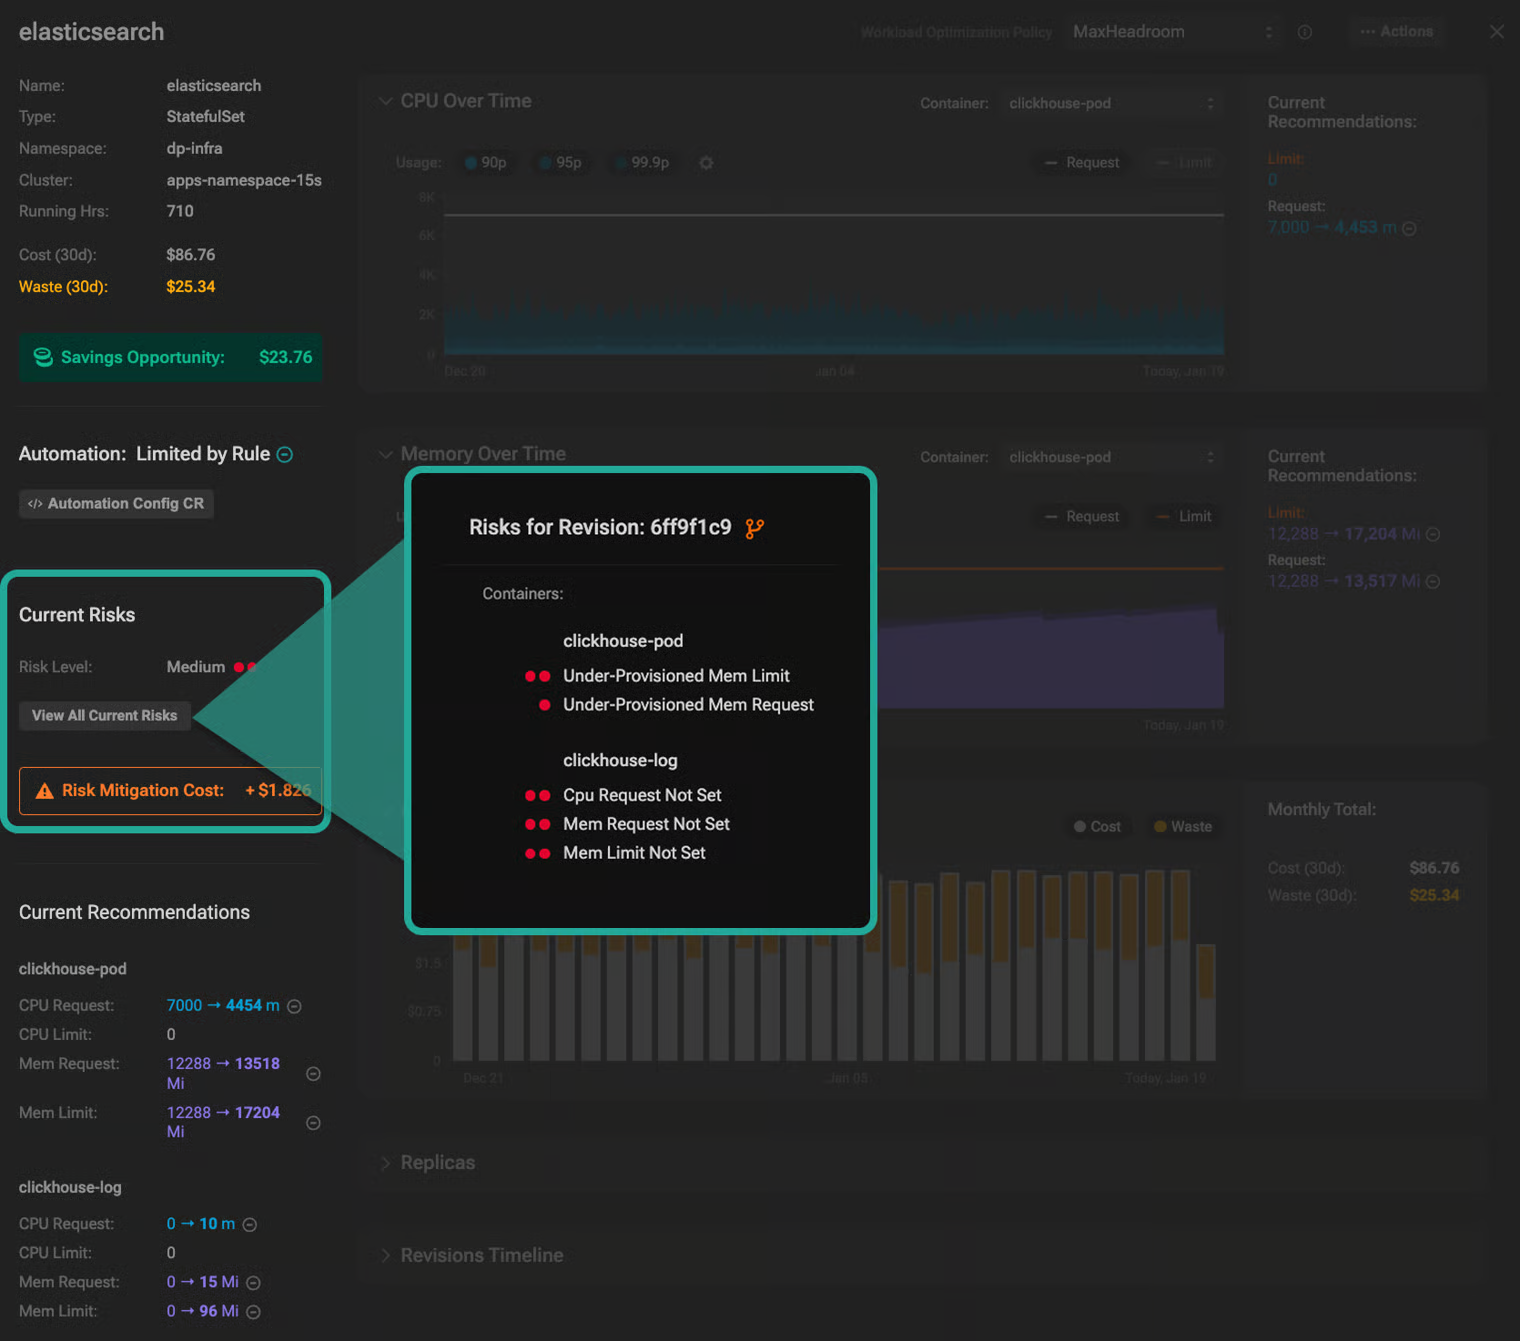
Current risks
The Revision Risks section provides an overview of the risks per container associated with this specific revision. Hover over the View All Risks to access the full list of risks.
This view is particularly helpful for quickly evaluating the workload's health at any given moment over the past 30 days.
Risk Mitigation Cost indicates the expected cost increase required to address performance risks caused by resource underprovisioning. This value is displayed only when resource increase recommendations exist, and the maturity threshold is met.
Recommendations
The recommendations are only available for the current revision.
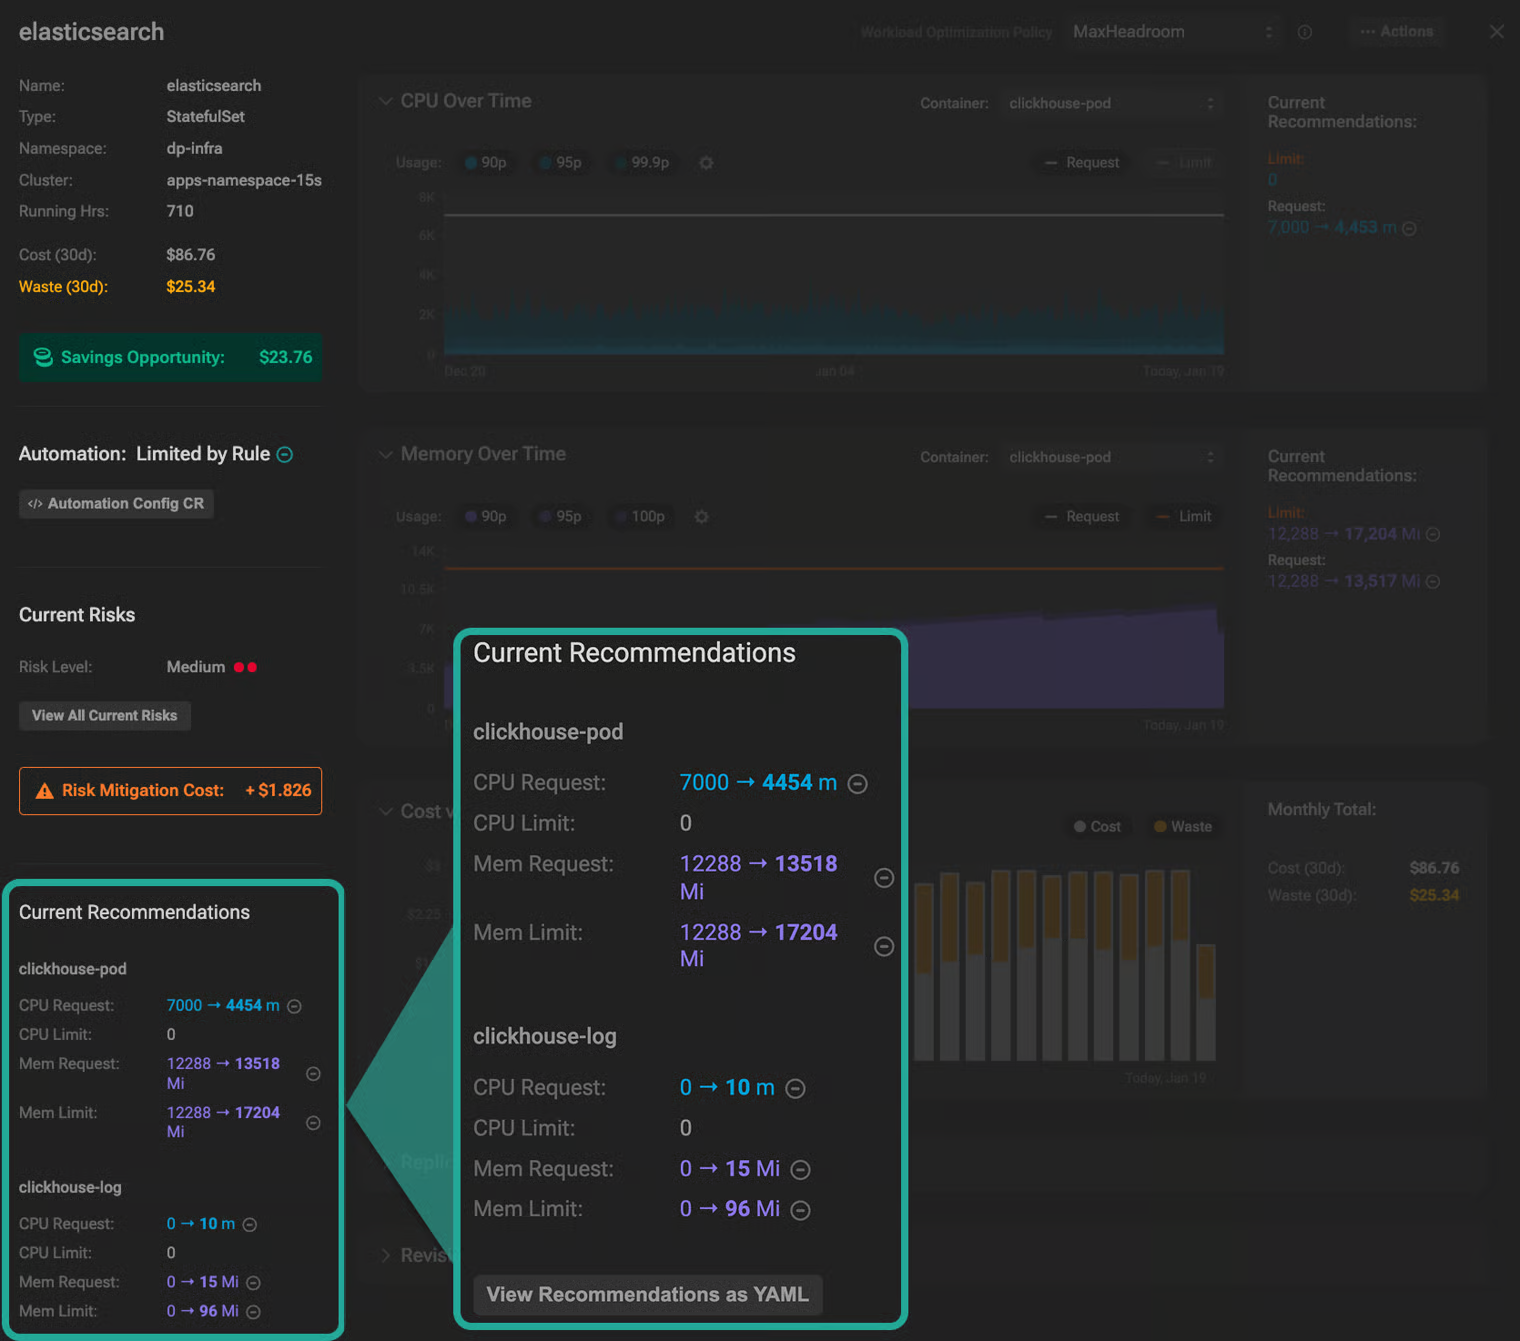
Recommendations
The recommendations widget provides policy-driven recommendations for workload right-sizing. With this comprehensive view, you can effortlessly review current resource requests and limits per container, followed by the recommended values based on the actual resource consumption.
To apply the recommendations manually, click the View REcommendations YAML button and deploy the recommendations to your cluster.
You can also seamlessly configure autonomous workload optimization to actively maintain your environment in prime condition and ensure peak K8s performance at minimal cost. Learn more about Automation configuration here.
Workload details panel
The workload details panel offers unparalleled visibility into workload resource utilization at any moment over the past 30 days, identifying inefficiencies in real-time and uncovering new optimization opportunities. Providing data-driven optimization recommendations empowers you to take action proactively, enhance efficiency, and reduce costs while maintaining high performance.
You can easily manage the order of widgets in the workload details panel. Grab the widget up or down by clicking on the widget name and moving it to the desired place on the panel.\ 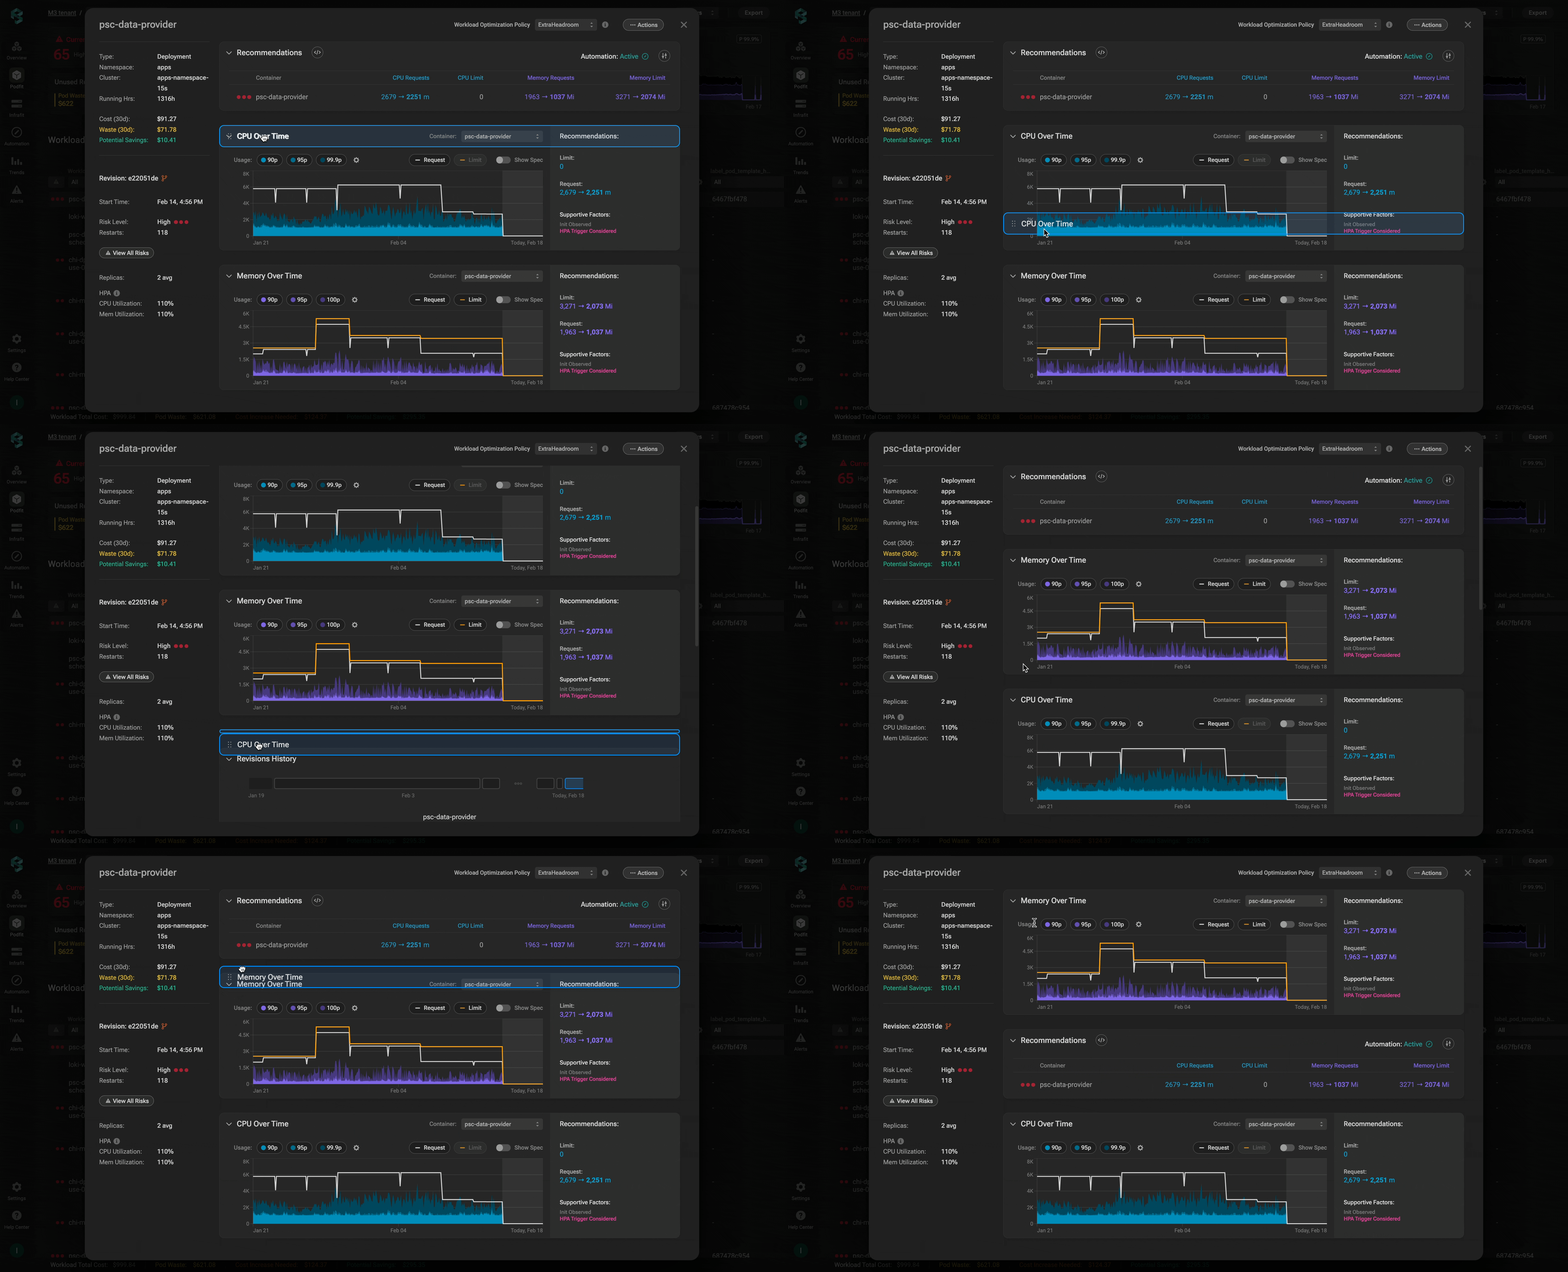
To reset the widgets to the default order, select Revert to Default Layout from the Actions menu.
CPU and Memory Over Time
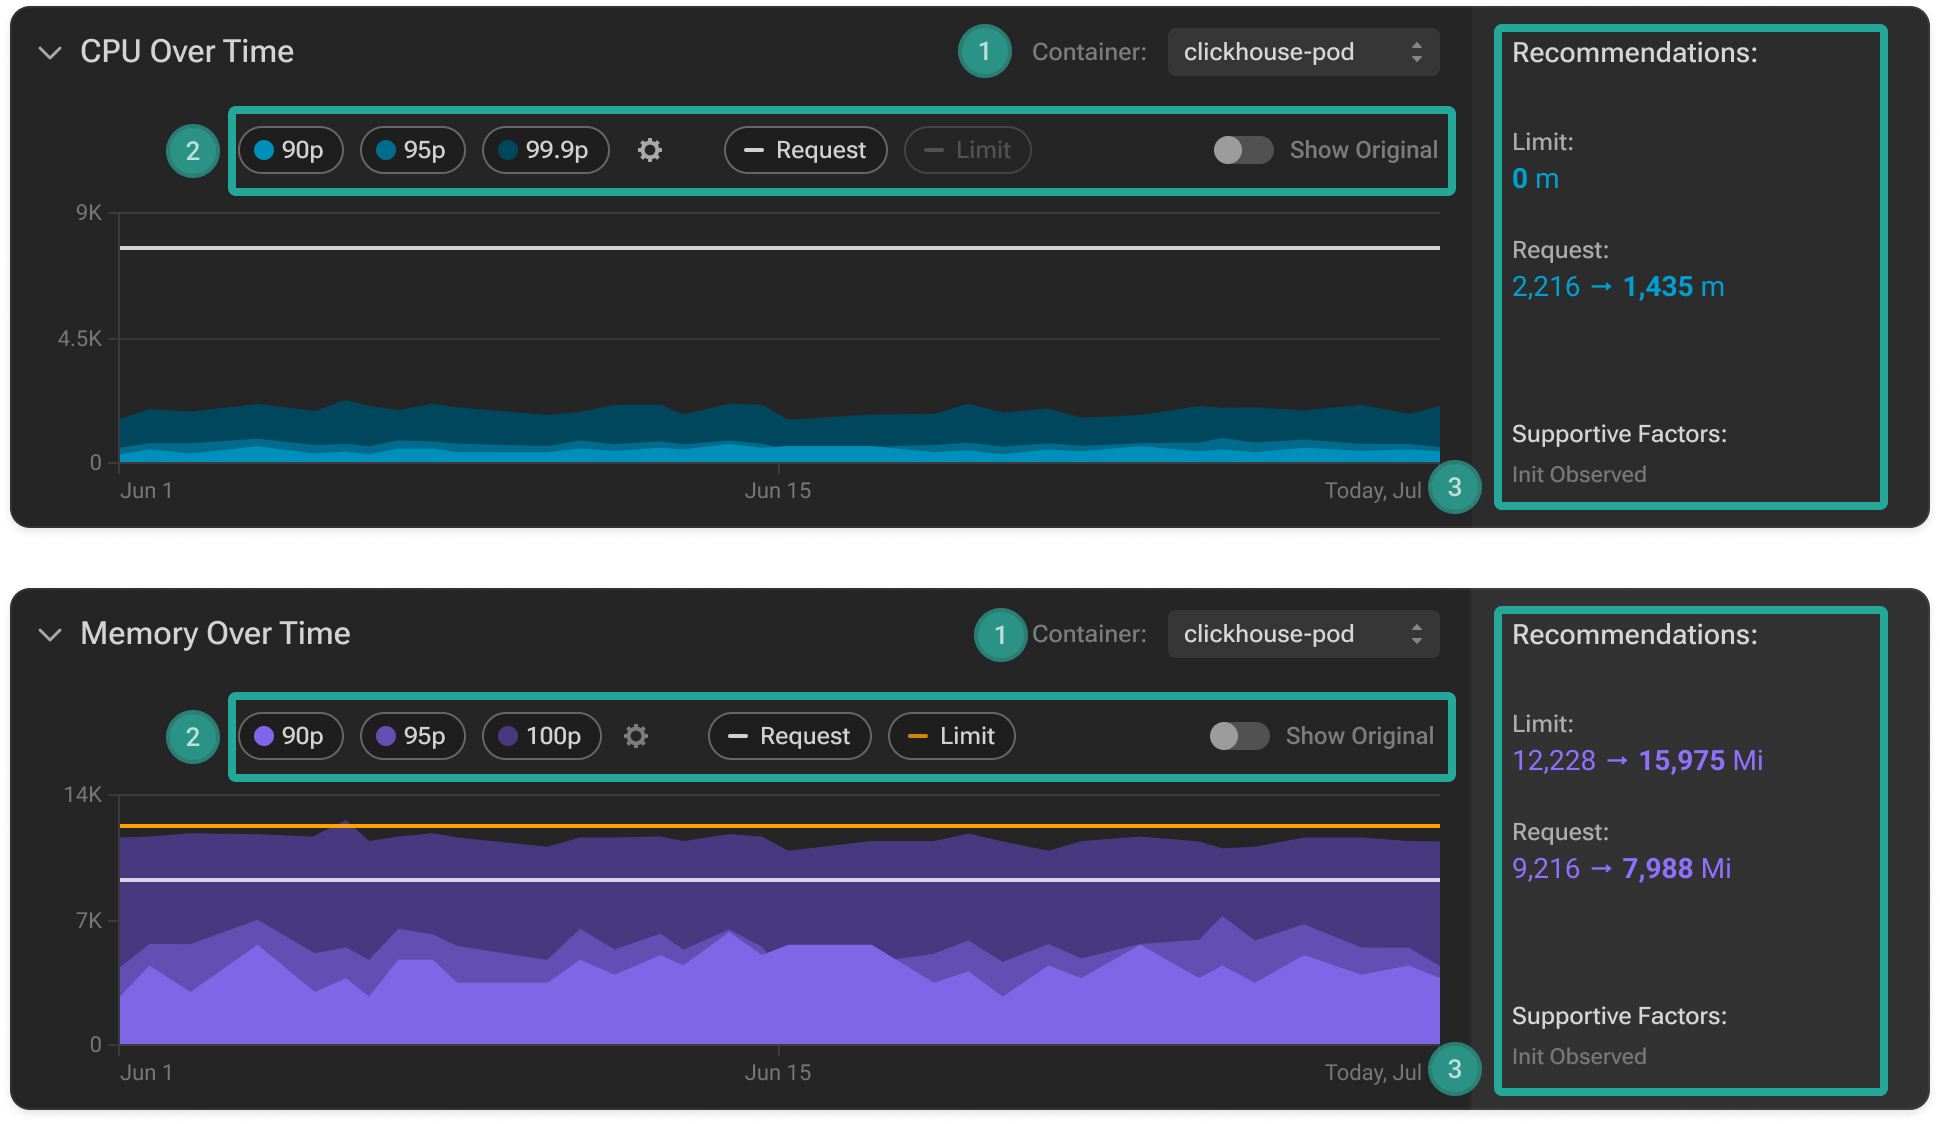
These widgets provide a granular historical view of CPU and Memory utilization per container over the past 30 days, including the p90, p95, and p99.9 utilization percentiles, enabling you to seamlessly evaluate the efficiency of resource distribution by leveraging a comprehensive visual comparison of these values with set resource requests and limits.
CPU & Memory over time
-
Container selector allows you to easily switch between containers to display the data for the specific container. Click the drop-down menu and select the needed container from the list.
-
Control panel includes toggles that allow you to easily add or remove quantile lines from the chart. This feature is especially useful for managing data display, enabling smooth workload analysis with just a few clicks.
Clicking on the toggles will either include or exclude the corresponding quantile lines from the chart.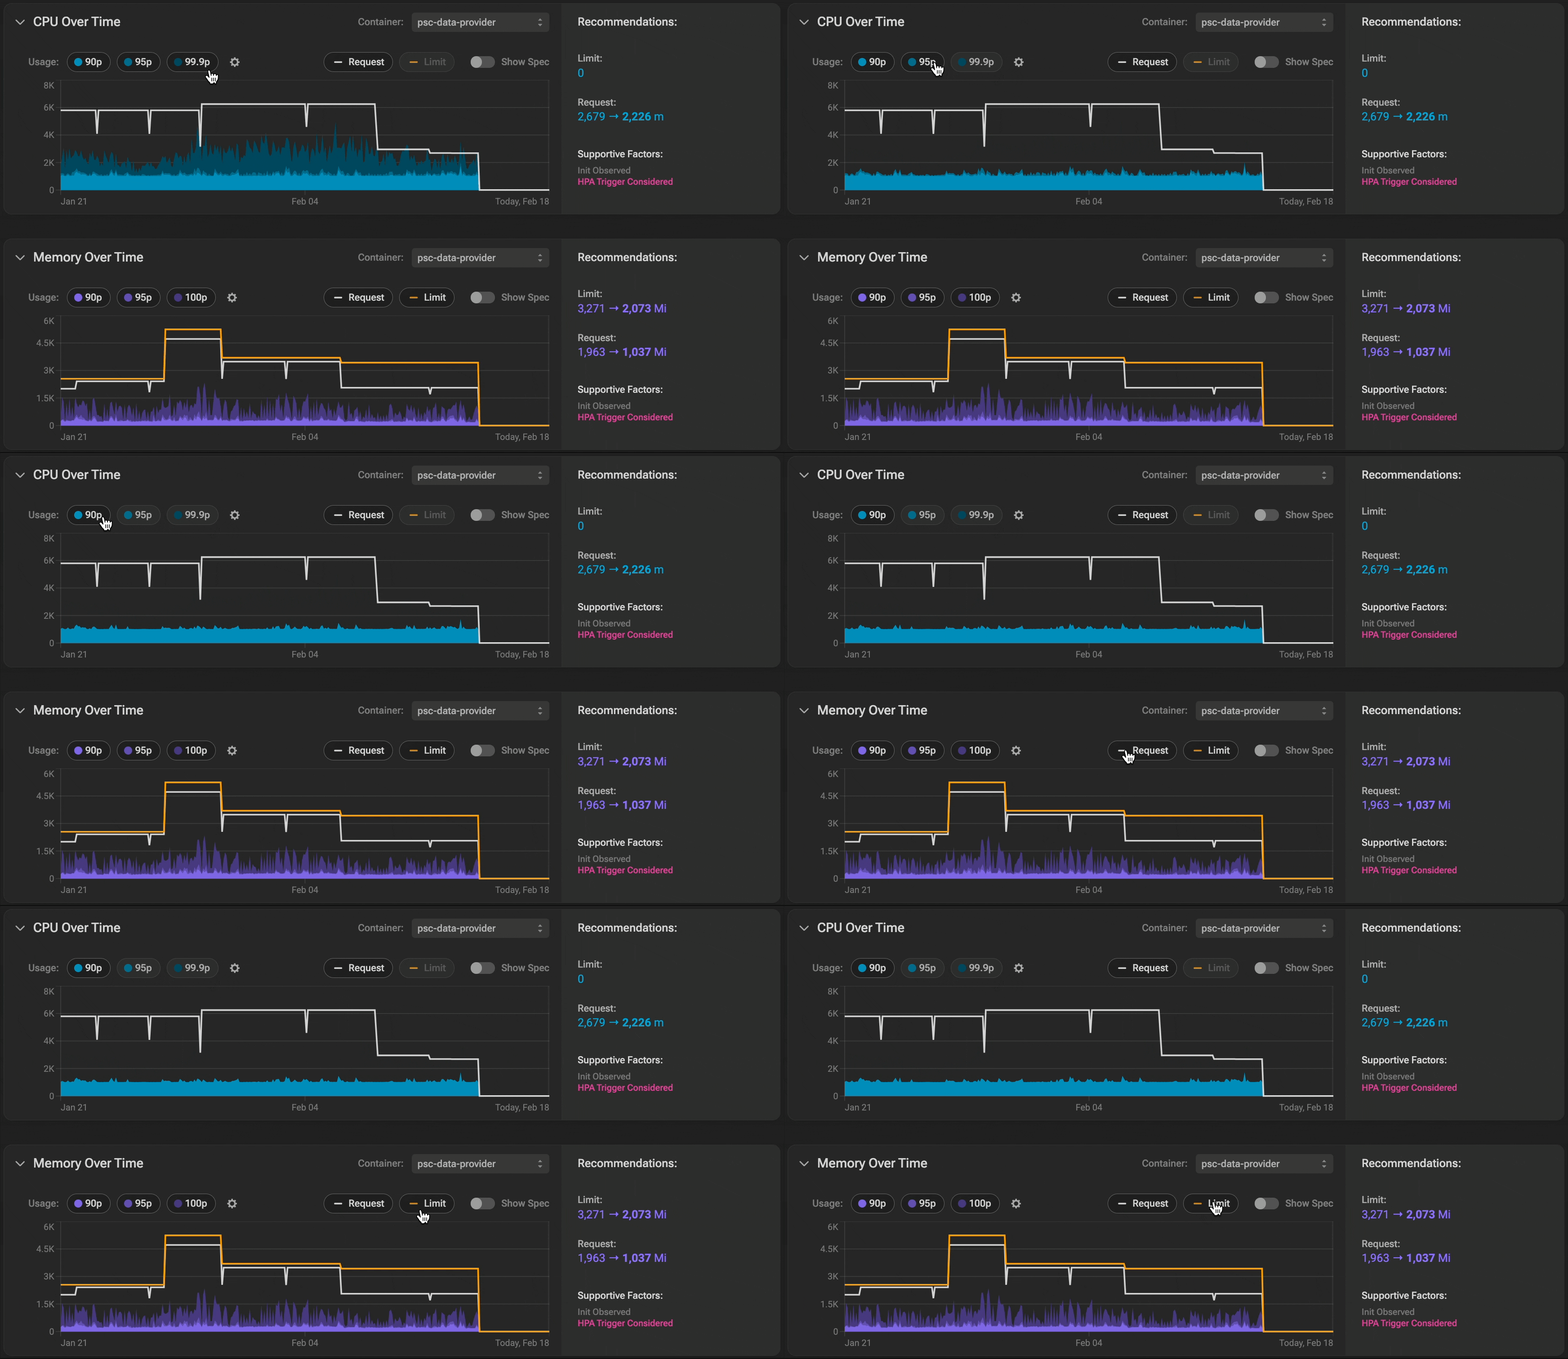
Percentiles
Use the gear button to define the custom percentile.
- Recommendations section displays the policy-driven resource requests and limits recommendations for the selected container compared to the current values.
Cost vs Waste
This widget provides a comprehensive historical cost and waste overview across all containers within the workload. It is particularly helpful for understanding cost and waste trends as well as identifying anomalies and spikes.
Cost is determined by the maximum of resources allocated or used (p90) on each machine. Any remaining machine headroom is not distributed across multiple workloads.
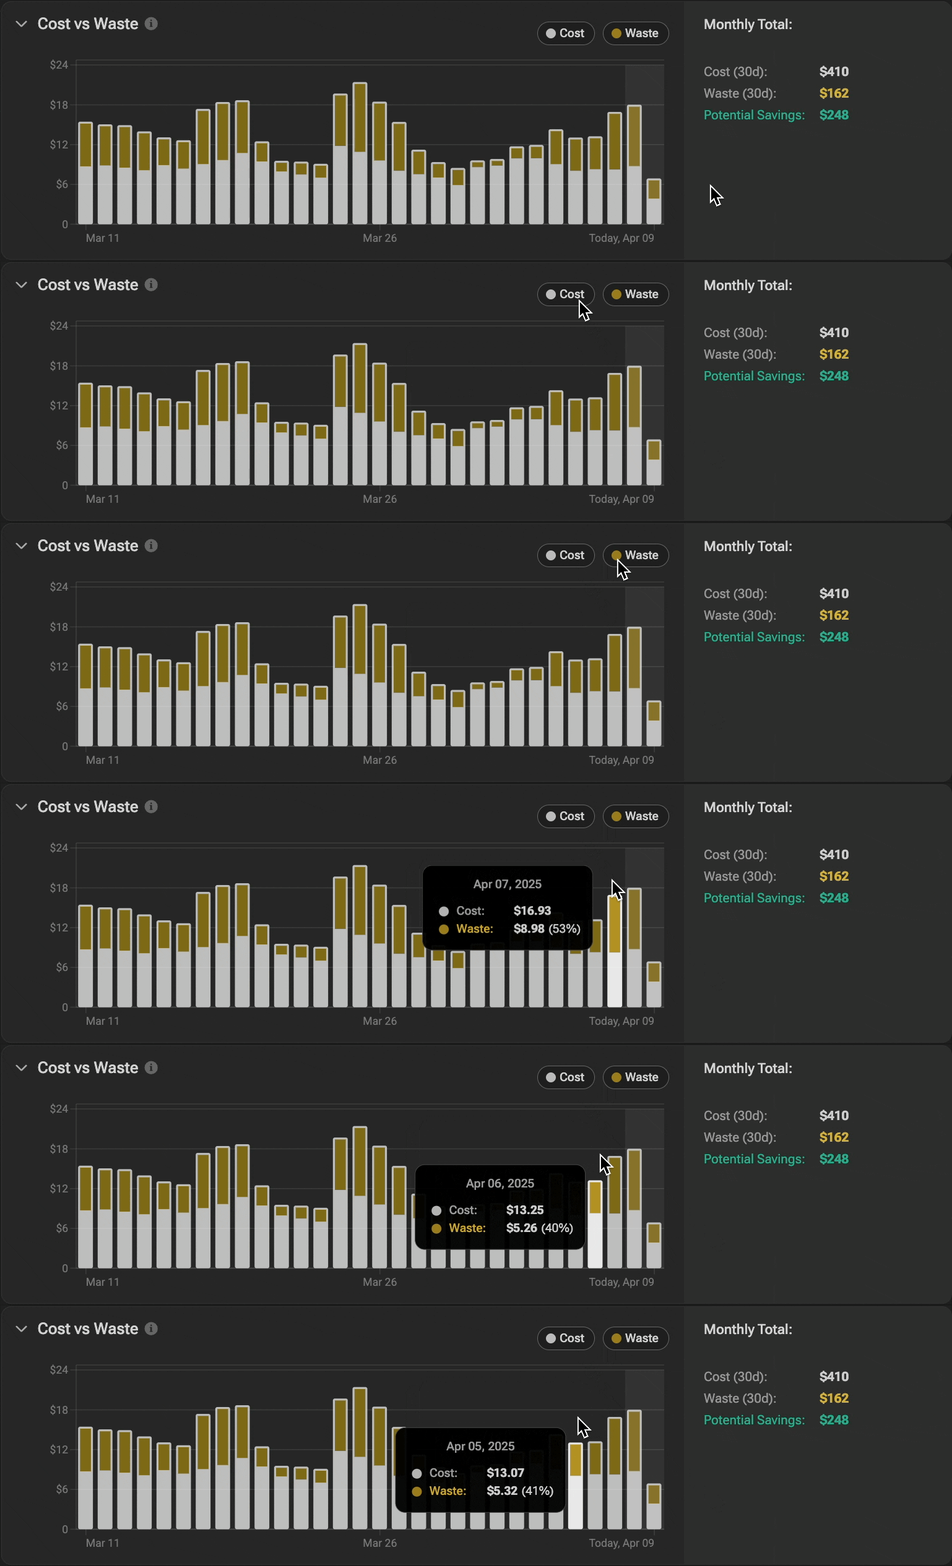
Cost vs waste widget
Replicas
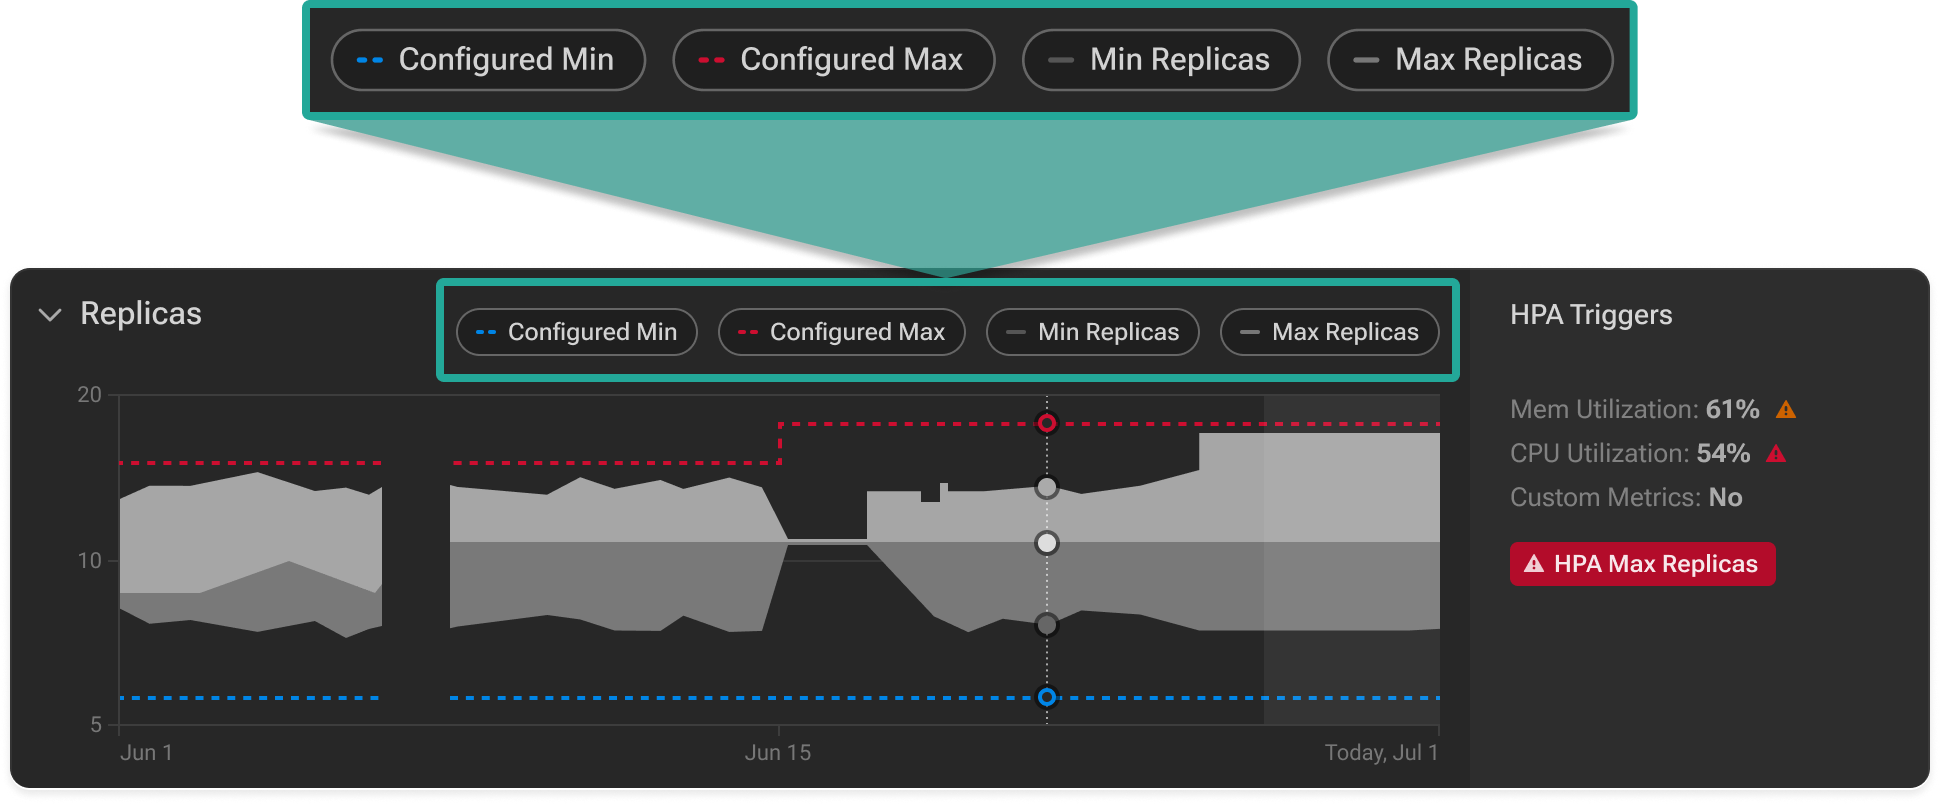
This widget provides a comprehensive view of workload replicas, allowing you to track scaling trends over time. This view supports both scaling scenarios: a static replica count when HPA is not used and dynamic scaling when HPA has been introduced.
When the number of replicas is static, PerfectScale shows the average amount of replicas captured.
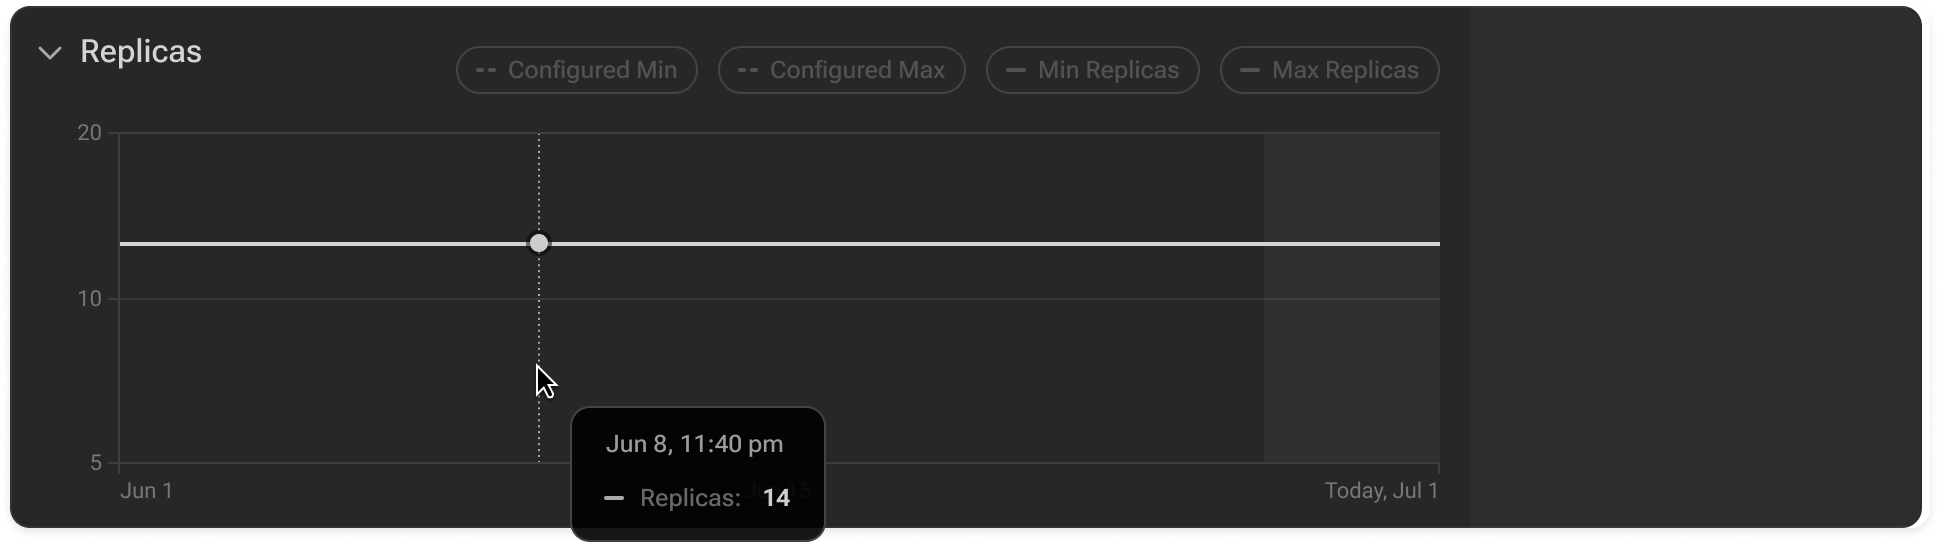
Static replicas
When HPA is enabled for a workload, the replicas widget provides a comprehensive view of all key configured parameters alongside the actual scaling values over time. On the right side of the widget, you’ll also find the configured HPA triggers and an indicator showing whether the maximum replica count has been reached, helping you monitor scaling behavior, detect spikes, and ensure efficient resource allocation.
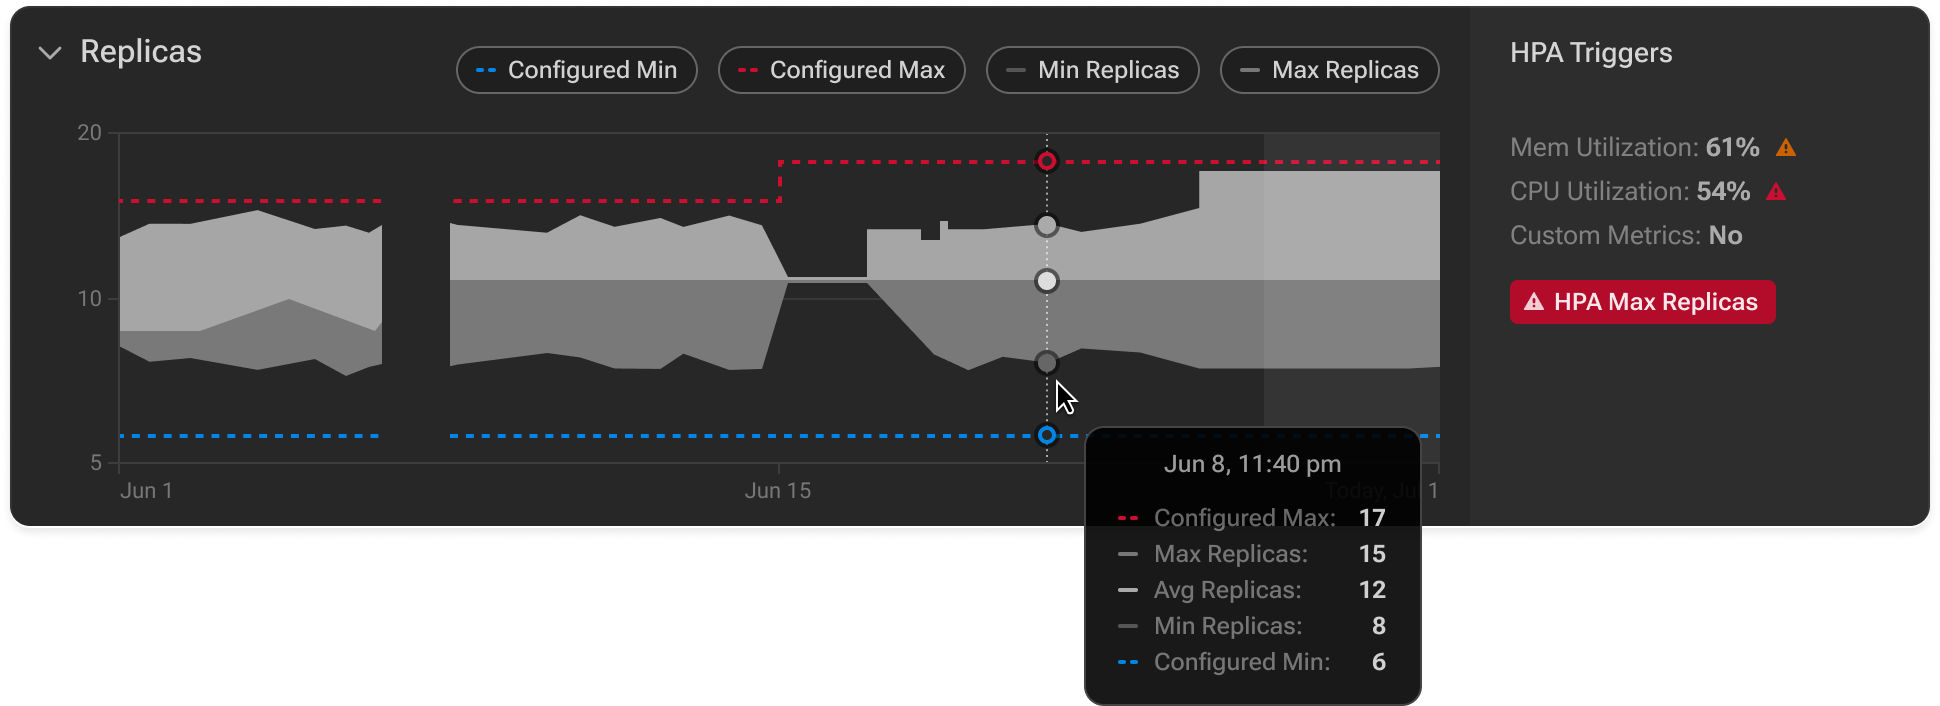
Dynamic scaling
Click the controls above the graph to display or conceal specific parameters.
Revisions Timeline
Effective optimization of the environment requires understanding the release content and its impact on cost and resilience. PerfectScale built an advanced solution to address such issues and provide users with a comprehensive breakdown of every revision for each container. This enables easy comparison of versions to track issues and remediation effectiveness.
Revisions timeline
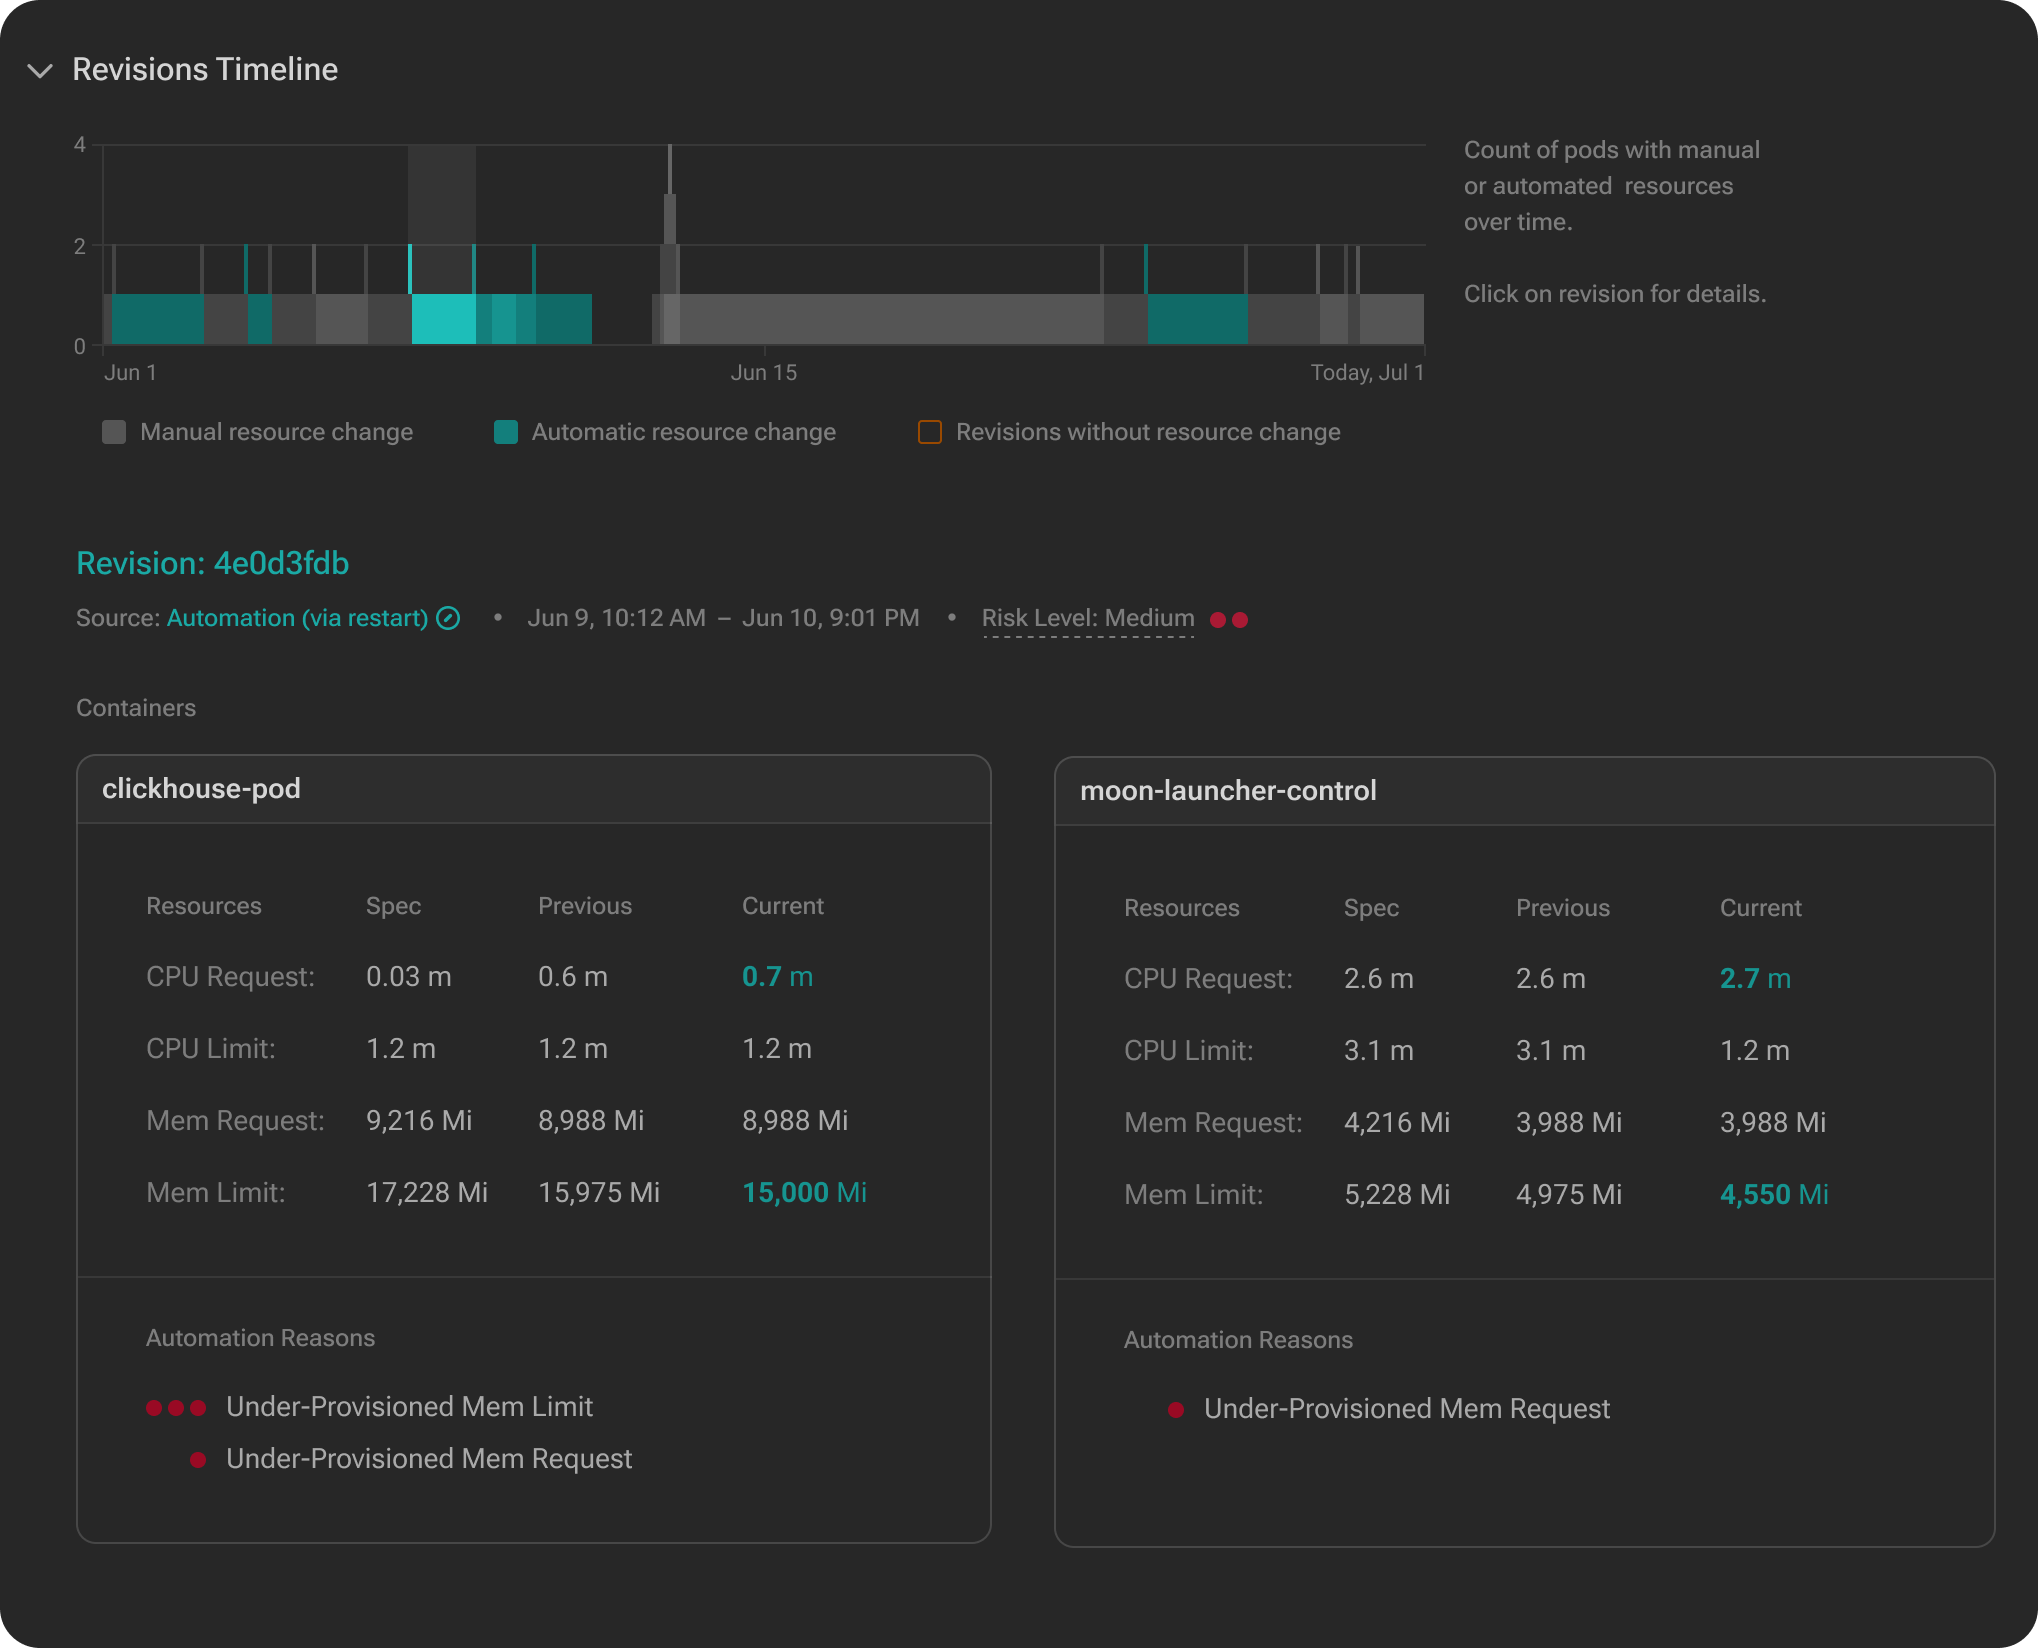
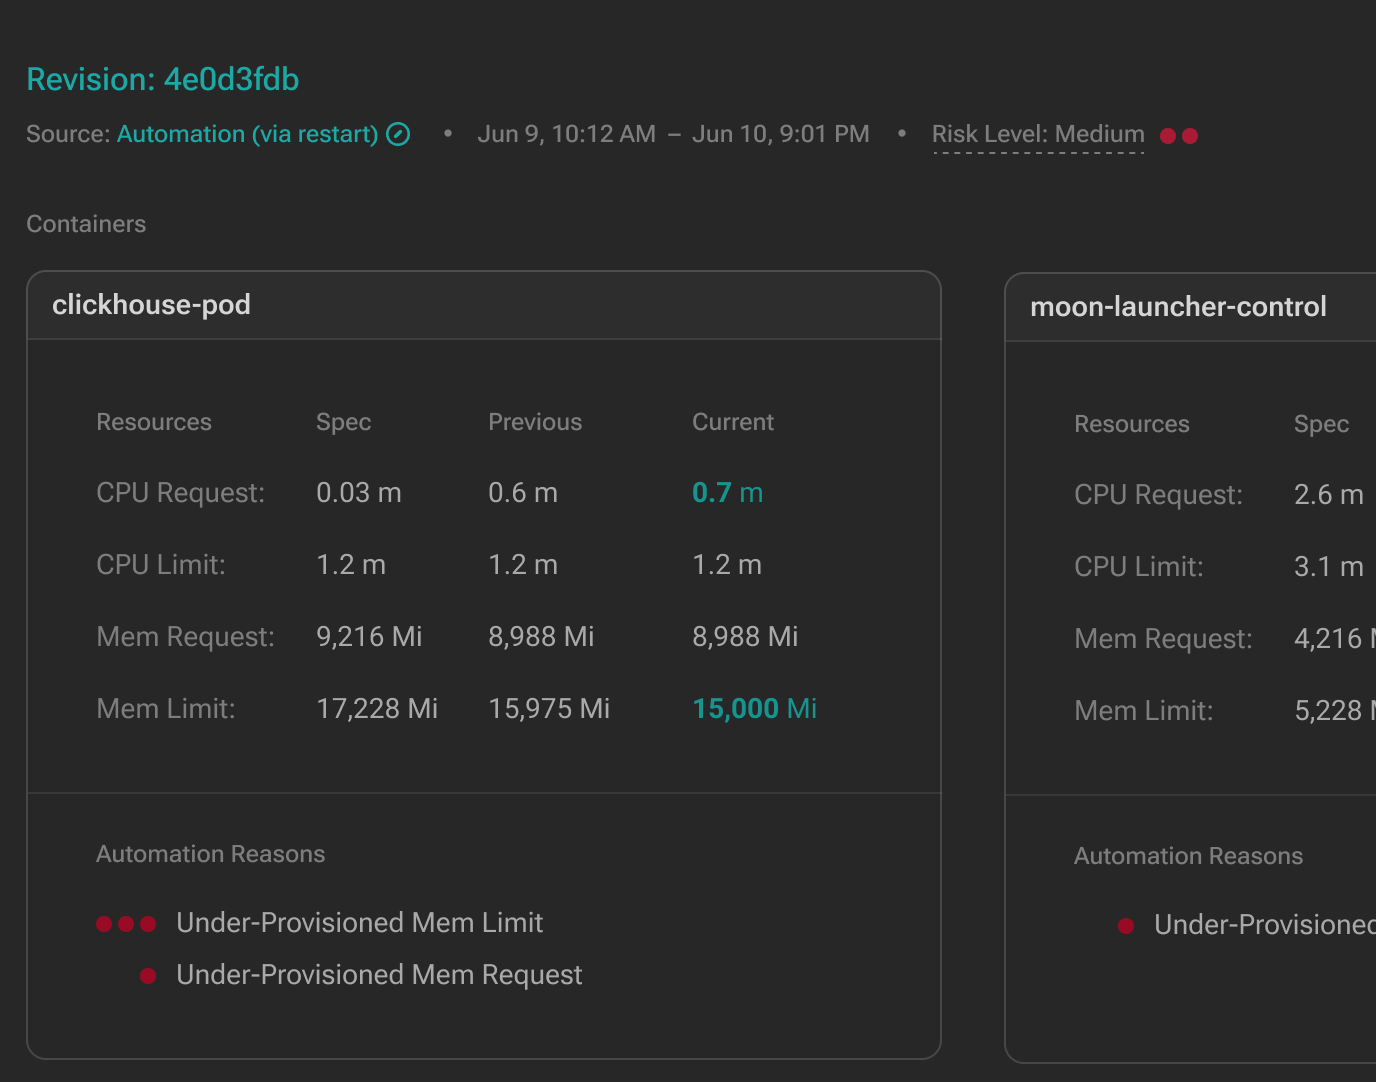
This view is particularly helpful for tracking when, why, and how resource allocations have changed over time. It displays the source of each revision, whether it was applied manually or through PerfectScale Automation, and, in the case of automated changes, explains the trigger of the action. It also highlights revisions where no resource changes occurred, helping users quickly identify relevant updates. This level of transparency streamlines investigations and keeps teams informed about the reason behind every change and its impact.
The revisions timeline chart displays all the revisions for the last 30 days, where each section corresponds to a particular revision and indicates the number of pods running under it.
By hovering over the revision, the following details will be shown:
- Revision ID
- Revision date and time
- Revision trigger
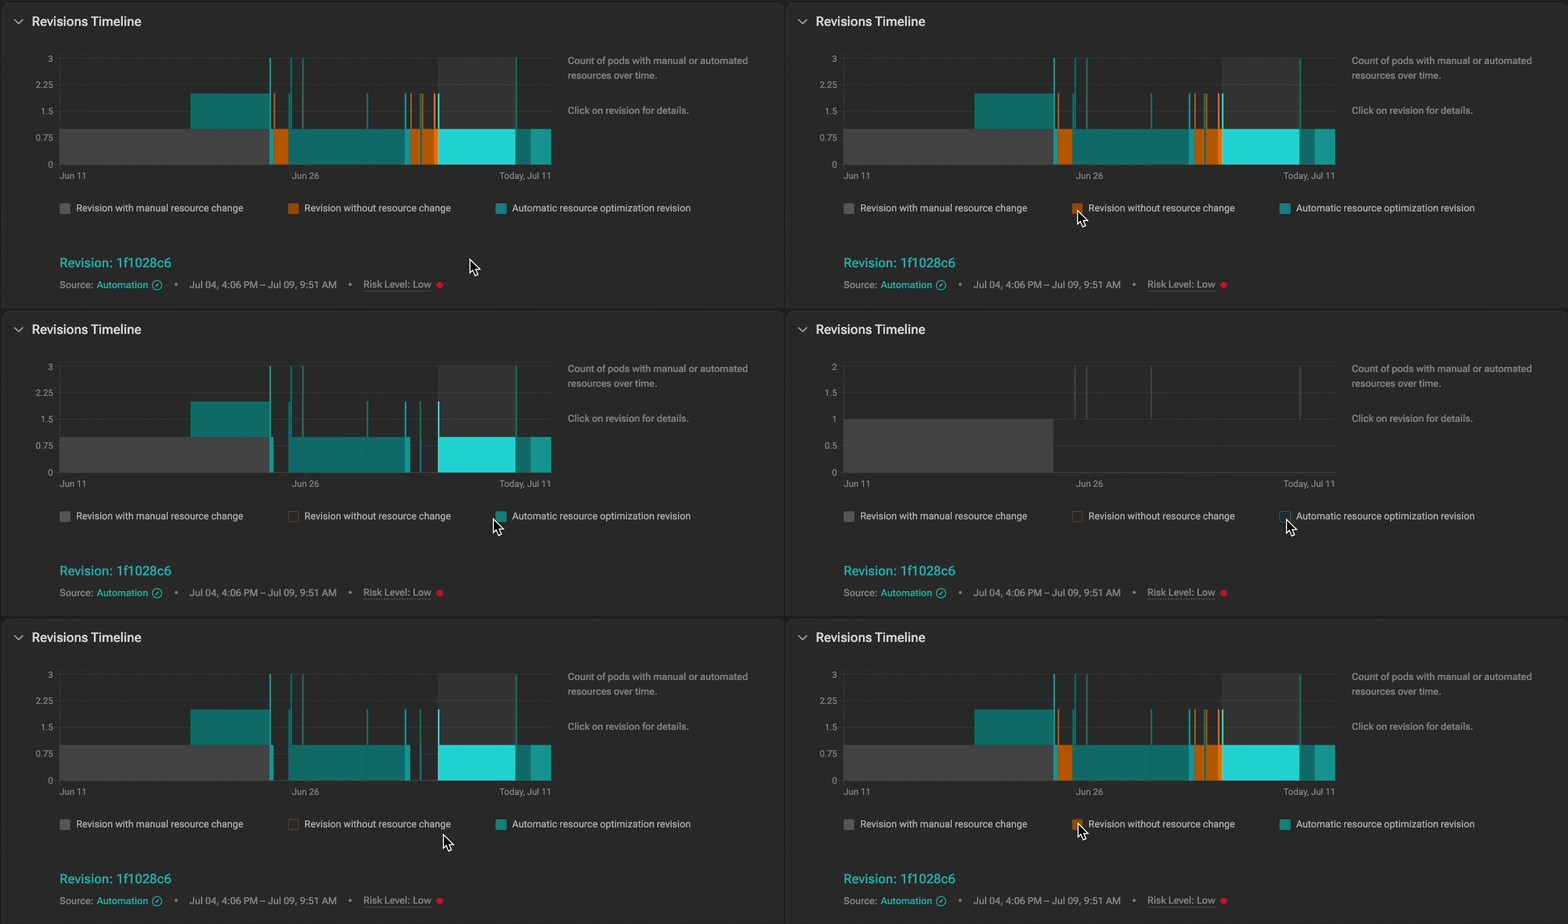
Use the revision selector to display specific revisions by including or excluding them. Click on the corresponding indicators to select or deselect them
Revisions selector
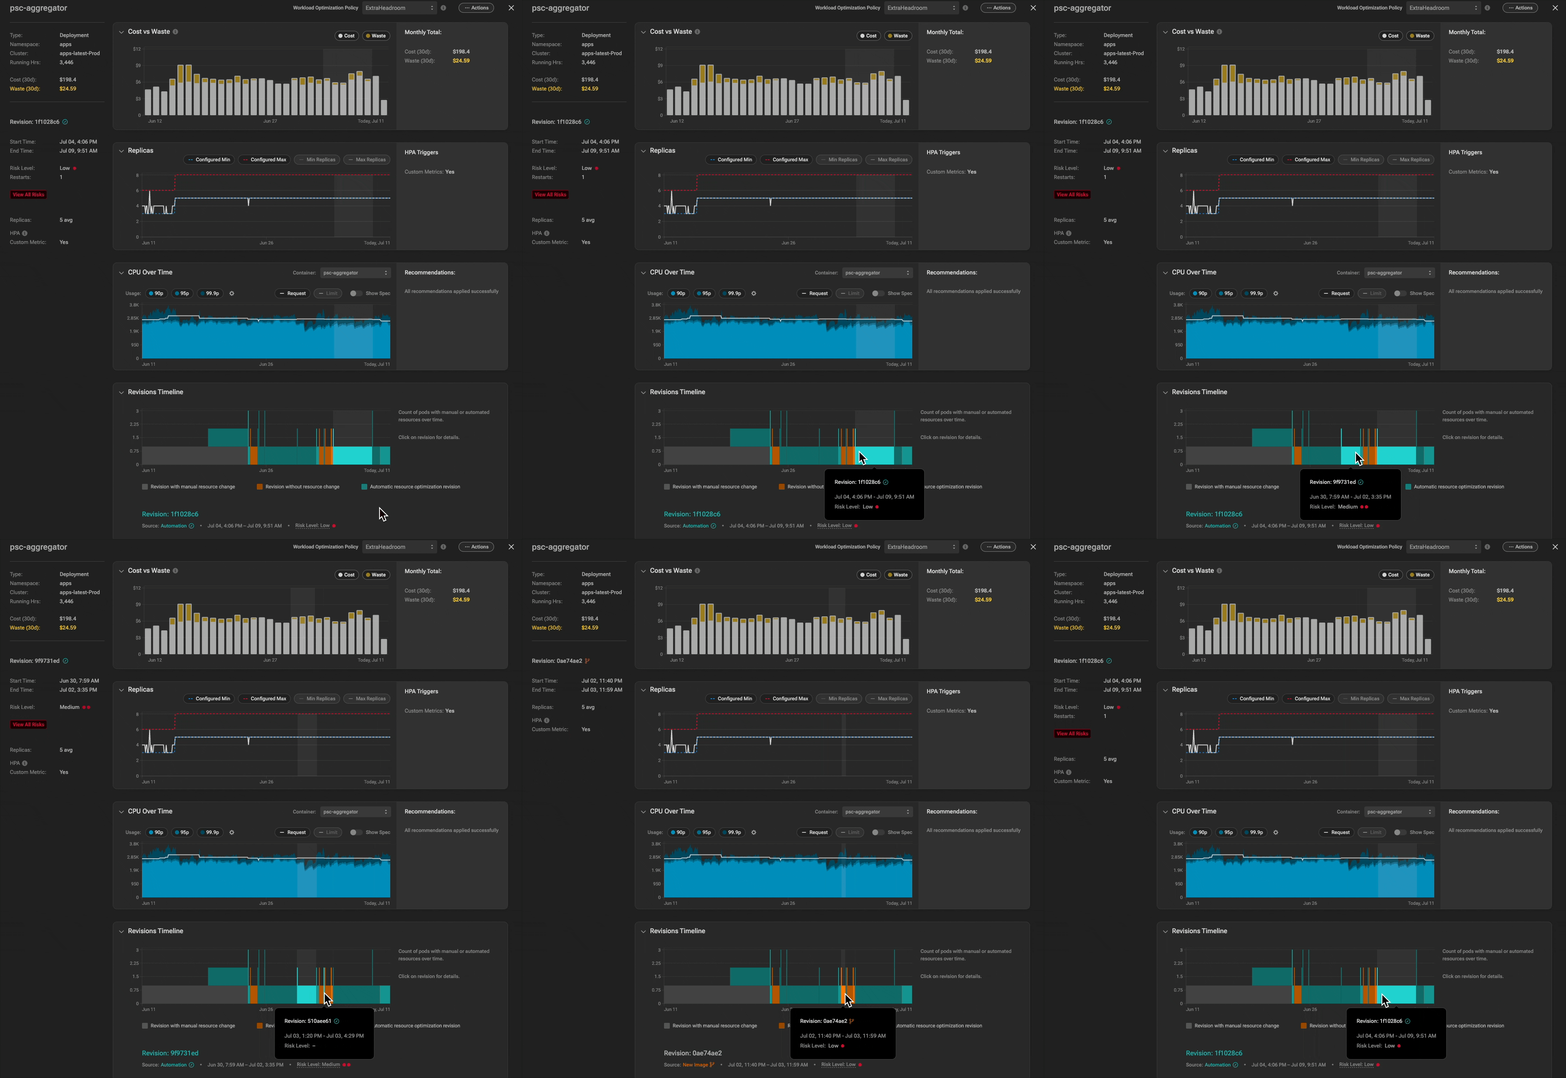
Clicking the revision will highlight this revision on the other Zoom-in window charts and display the corresponding data on the Workload summary panel, enabling you to access all the needed data and streamline the analysis with a single click.
Revision on the charts
When you select a specific revision, you’ll see details about what triggered it, what container(s) were affected, which resources were changed, and how. If it was done by Automation, you’ll also see what issue the change intended to fix.
Revision details