Observability — Self-hosted 2.0
With observability profiles, users can easily access the observability tool to view comprehensive data and usage patterns over a period of time.
PerfectScale Observability integration supports the following tools:
- Grafana
- DataDog
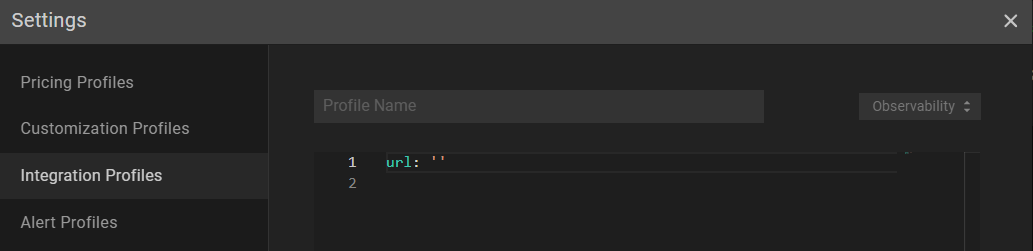
Observability profile
Configuring Observability with the profile
:tools: How to create Observability Profile
There are two options for creating a Profile: from the Settings tab or directly from the Overview.
From the Settings tab
Go to the Settings tab on the left panel -> select Integrations -> click the +Add Integration button and select Observability from the drop-down -> insert the required data.
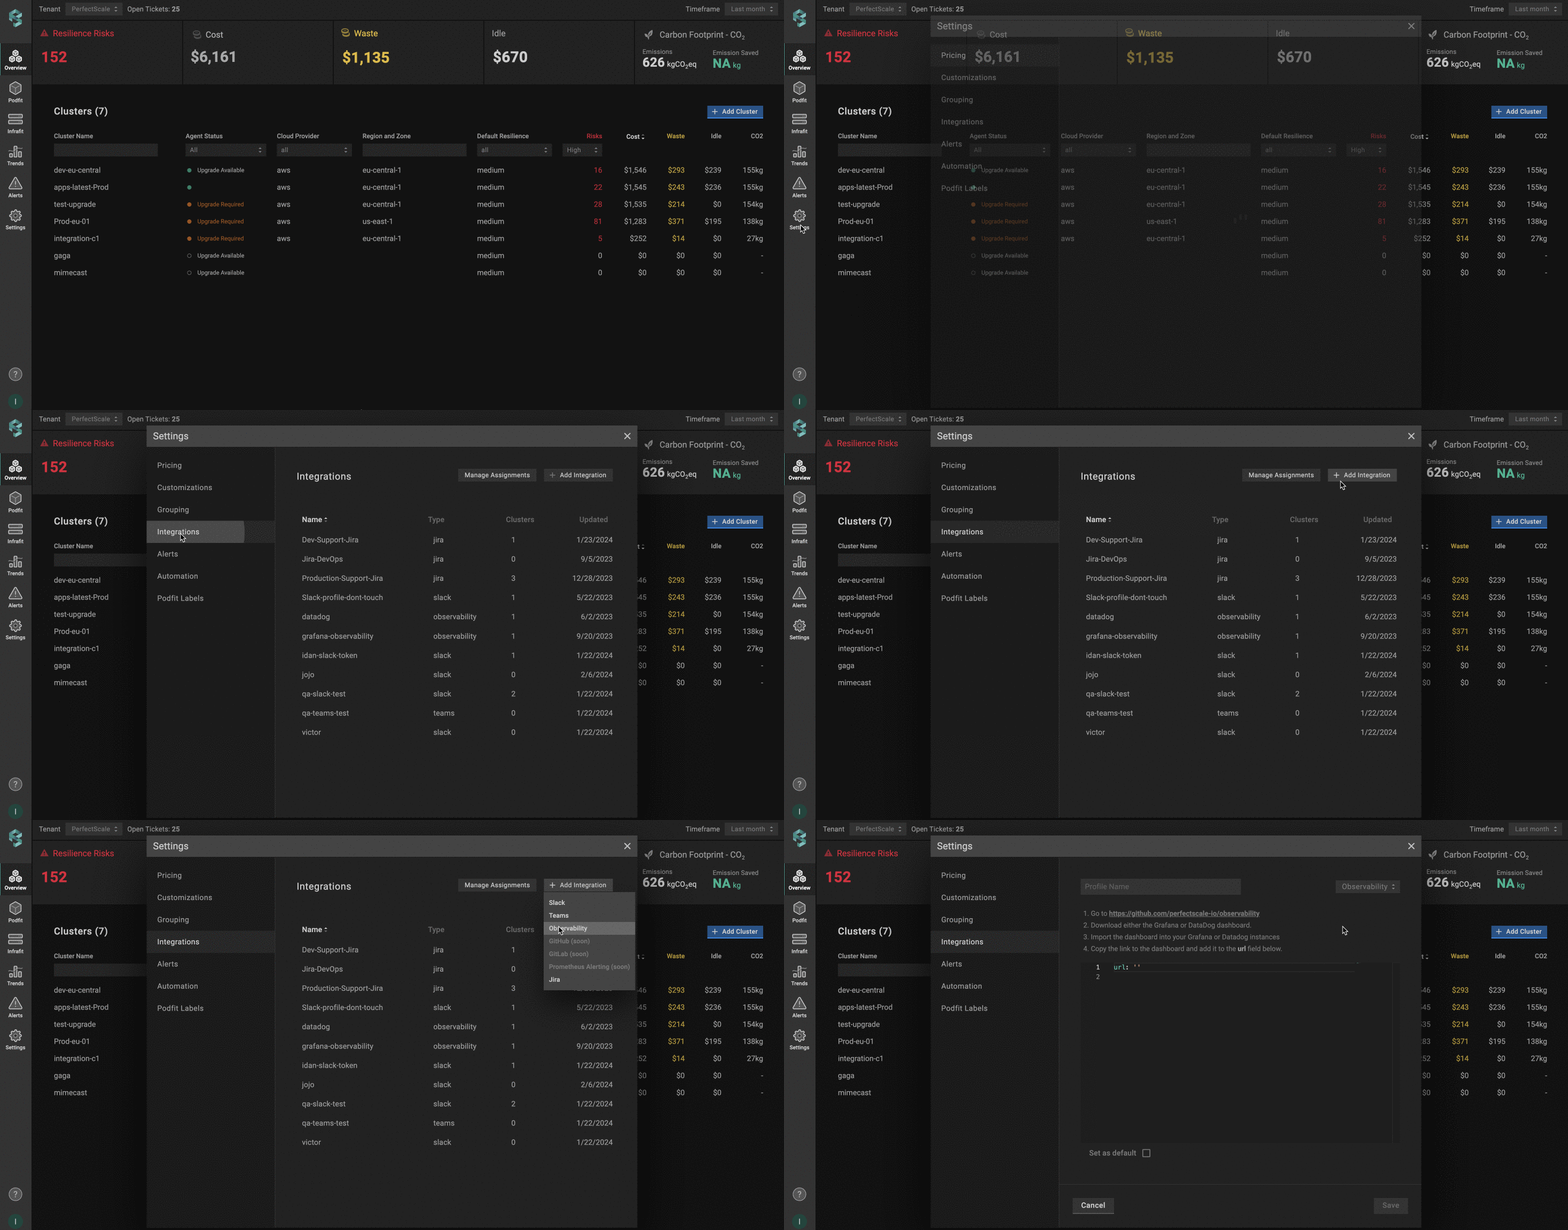
Observability profile from settings
From the Overview tab
Go to the Overview tab on the left panel -> find the cluster to which you want to apply the Profile and click gear button -> go to Customizations -> find Integrations and click the Observability drop-down list -> click the Add New Profile button -> insert the required data.
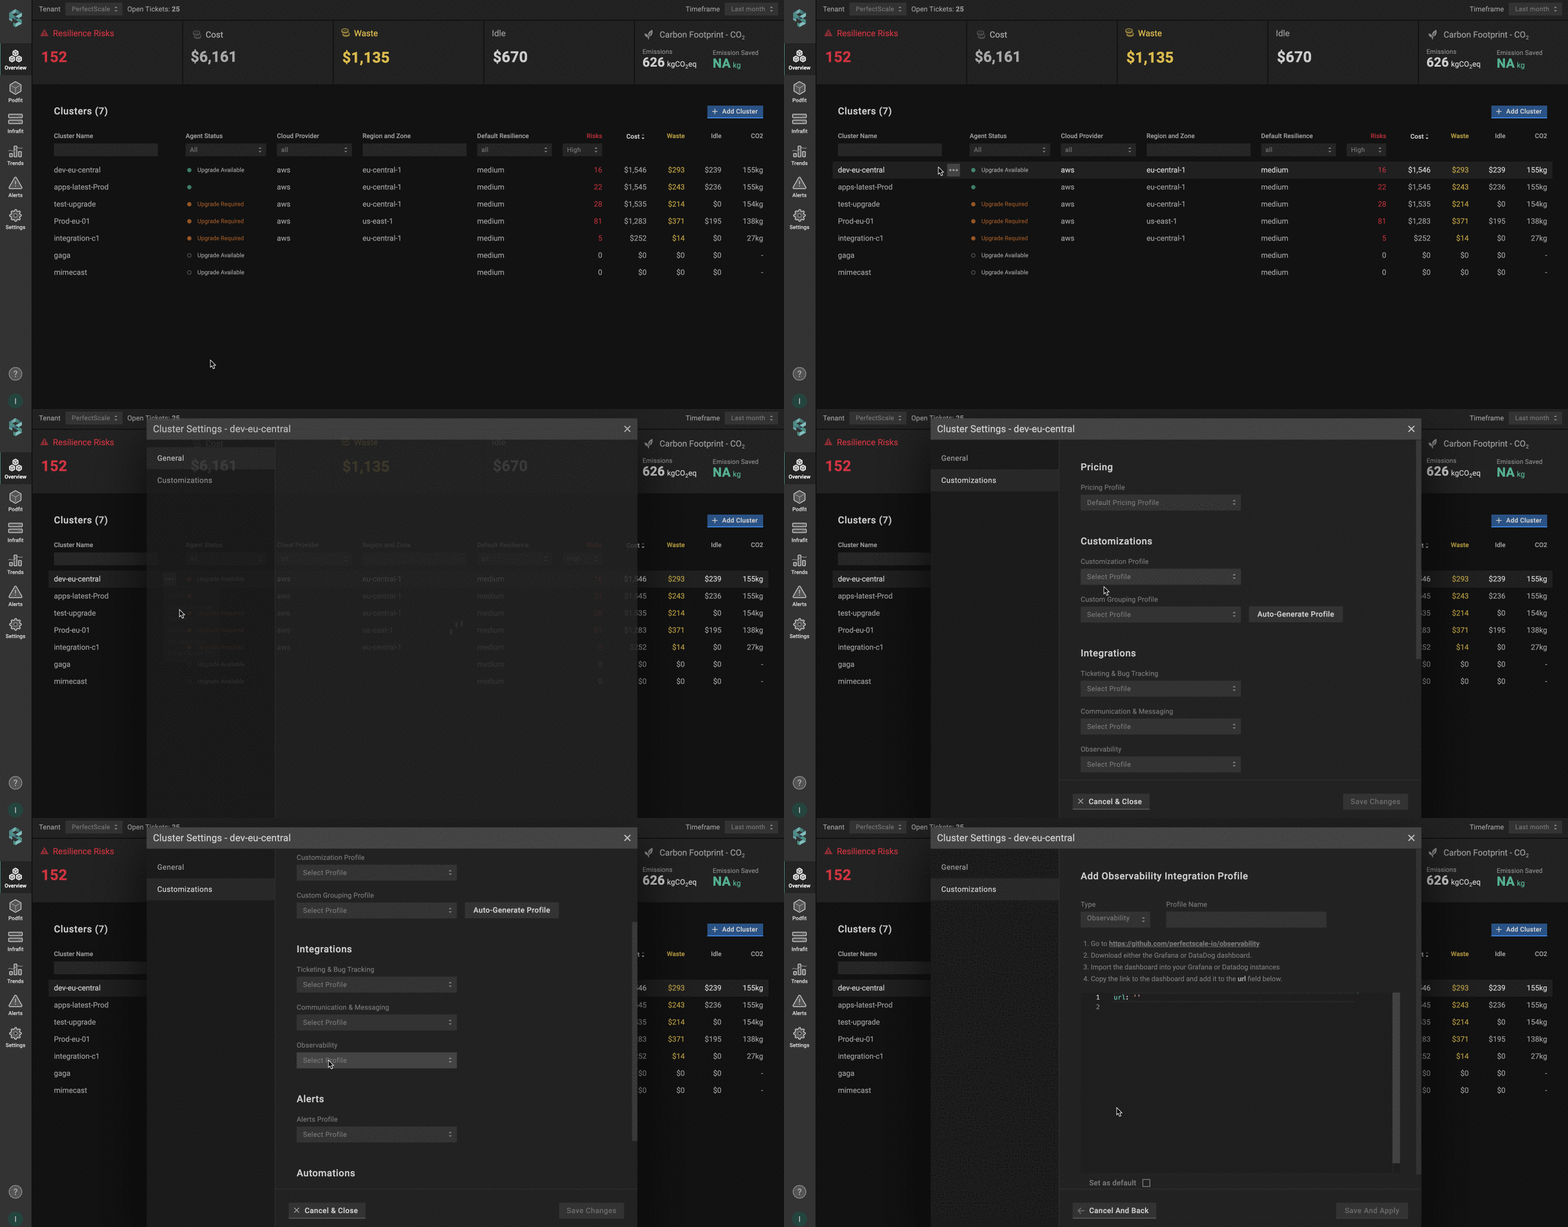
Observability profile from overview
Observability Profile Configuration
Create Grafana or DataDog URL in a few steps:
- Go to PerfectScale GitHub.
- Download either the Grafana or DataDog dashboard.
- Import the dashboard into your Grafana or DataDog instance.
- Copy the link to the dashboard (Grafana URL, DataDog URL).
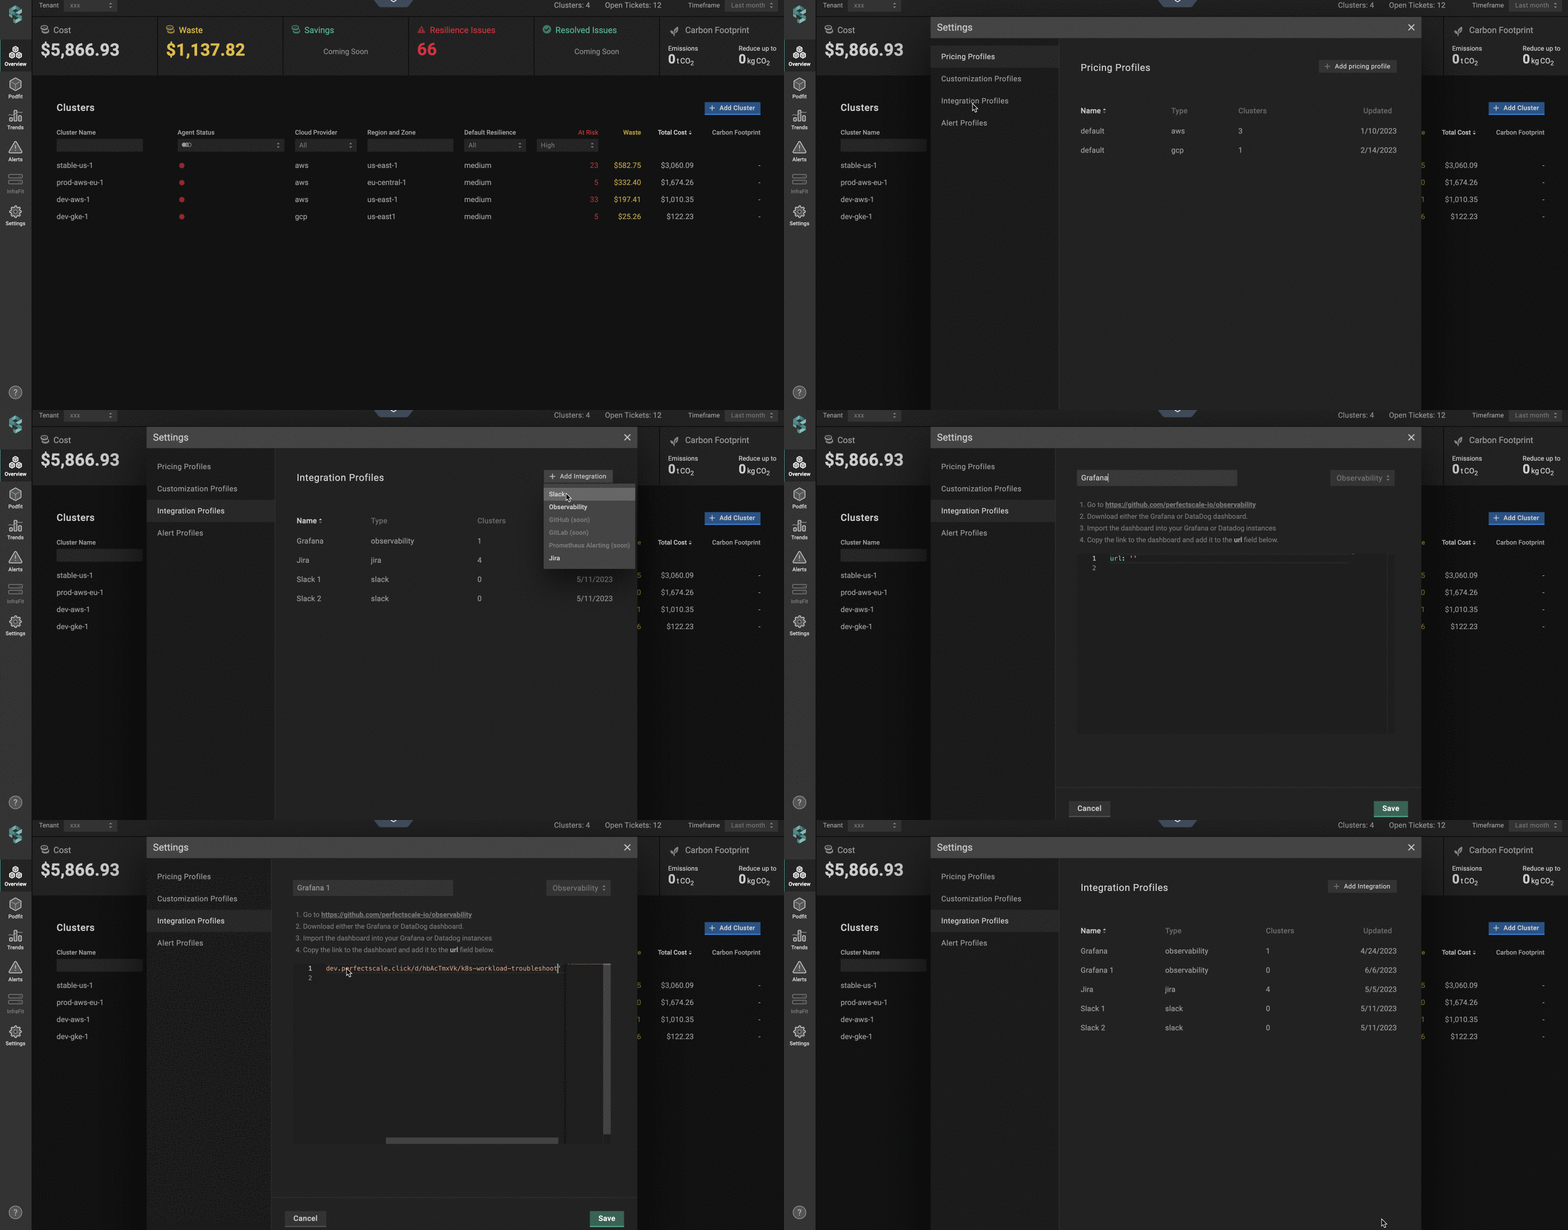
Observability provile configuration
Use Set as default checkbox to automatically assign the profile to the clusters.
💡 The manually assigned profile takes priority over the default one.
:tools: How to apply Observability Profile
Apply to a single cluster
To apply the Profile to the cluster, go to the Overview tab on the left panel -> find the cluster to which you want to apply the Profile and click gear button -> go to Customizations -> find Integrations and click the Observability drop-down list -> select the needed profile.
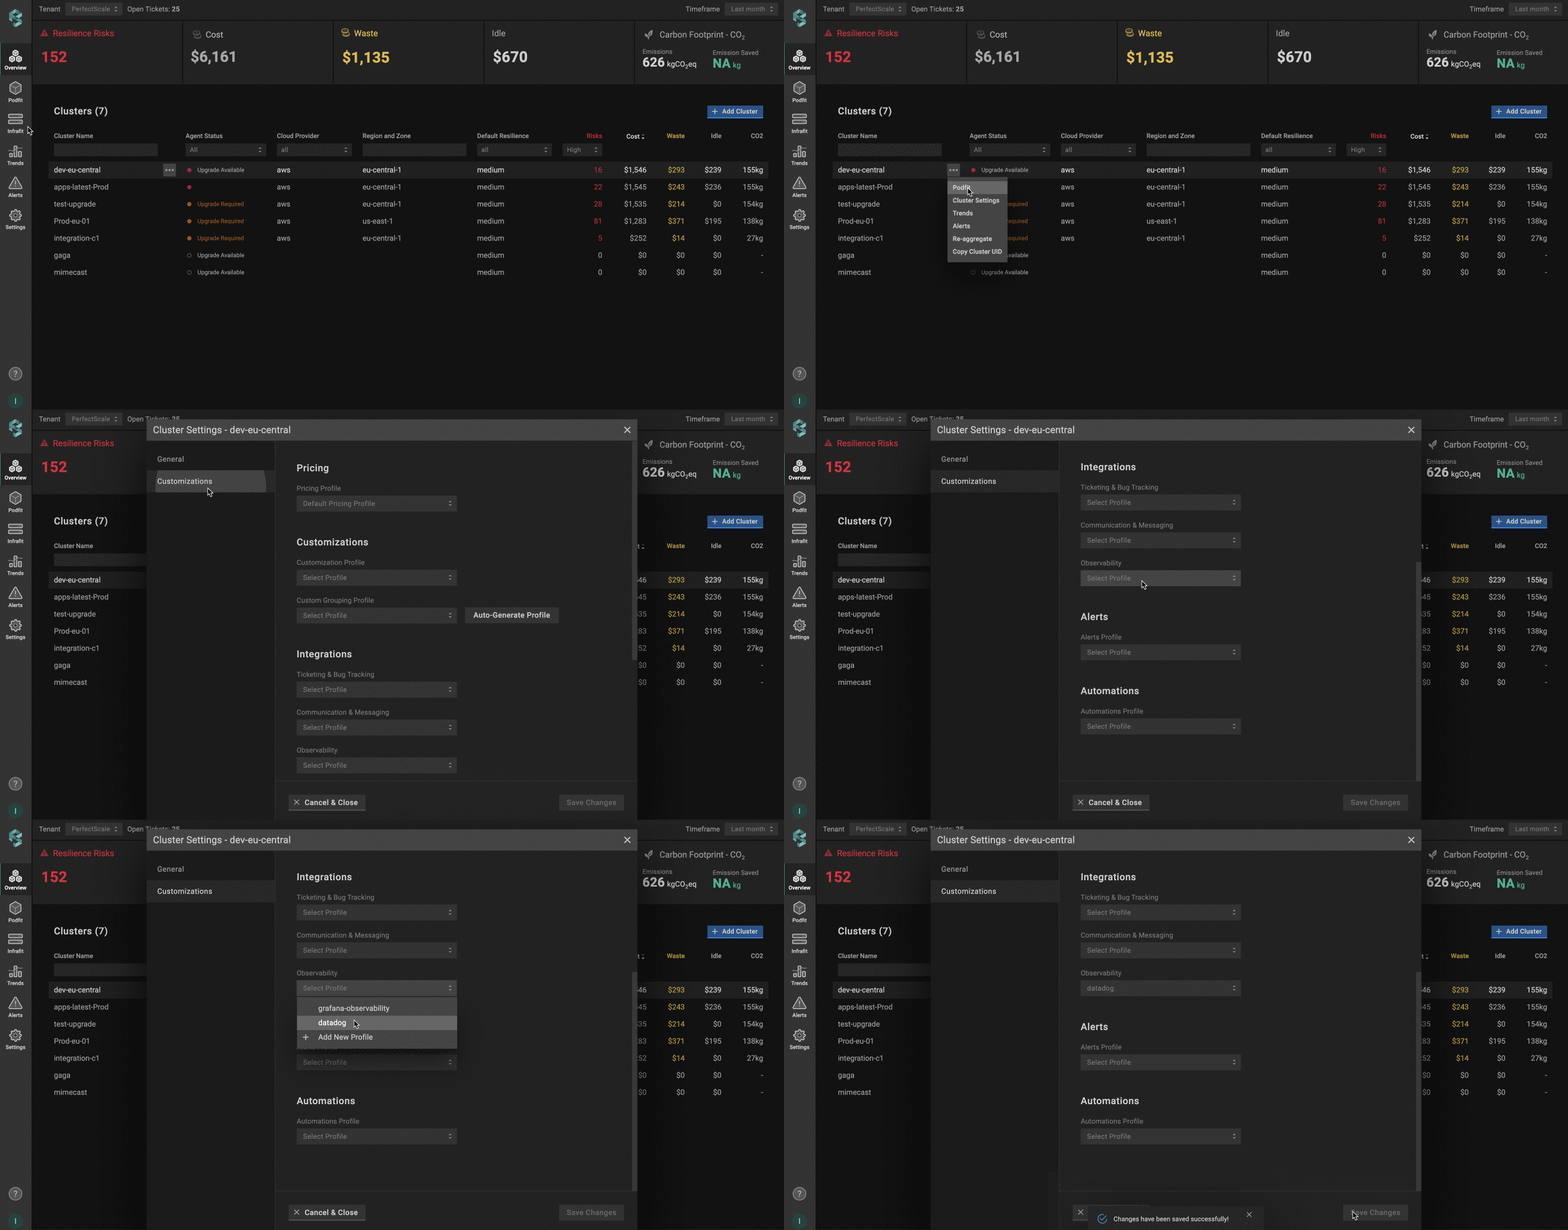
Applying observability profile to a single cluster
Apply to multiple clusters
To apply a profile to multiple clusters from a single view, use the Manage Assignments feature.
Go to the Settings tab on the left panel -> select Integrations -> click the Manage Assignments button -> apply the profile for the needed clusters in the Observability section -> click the Save Changes button.
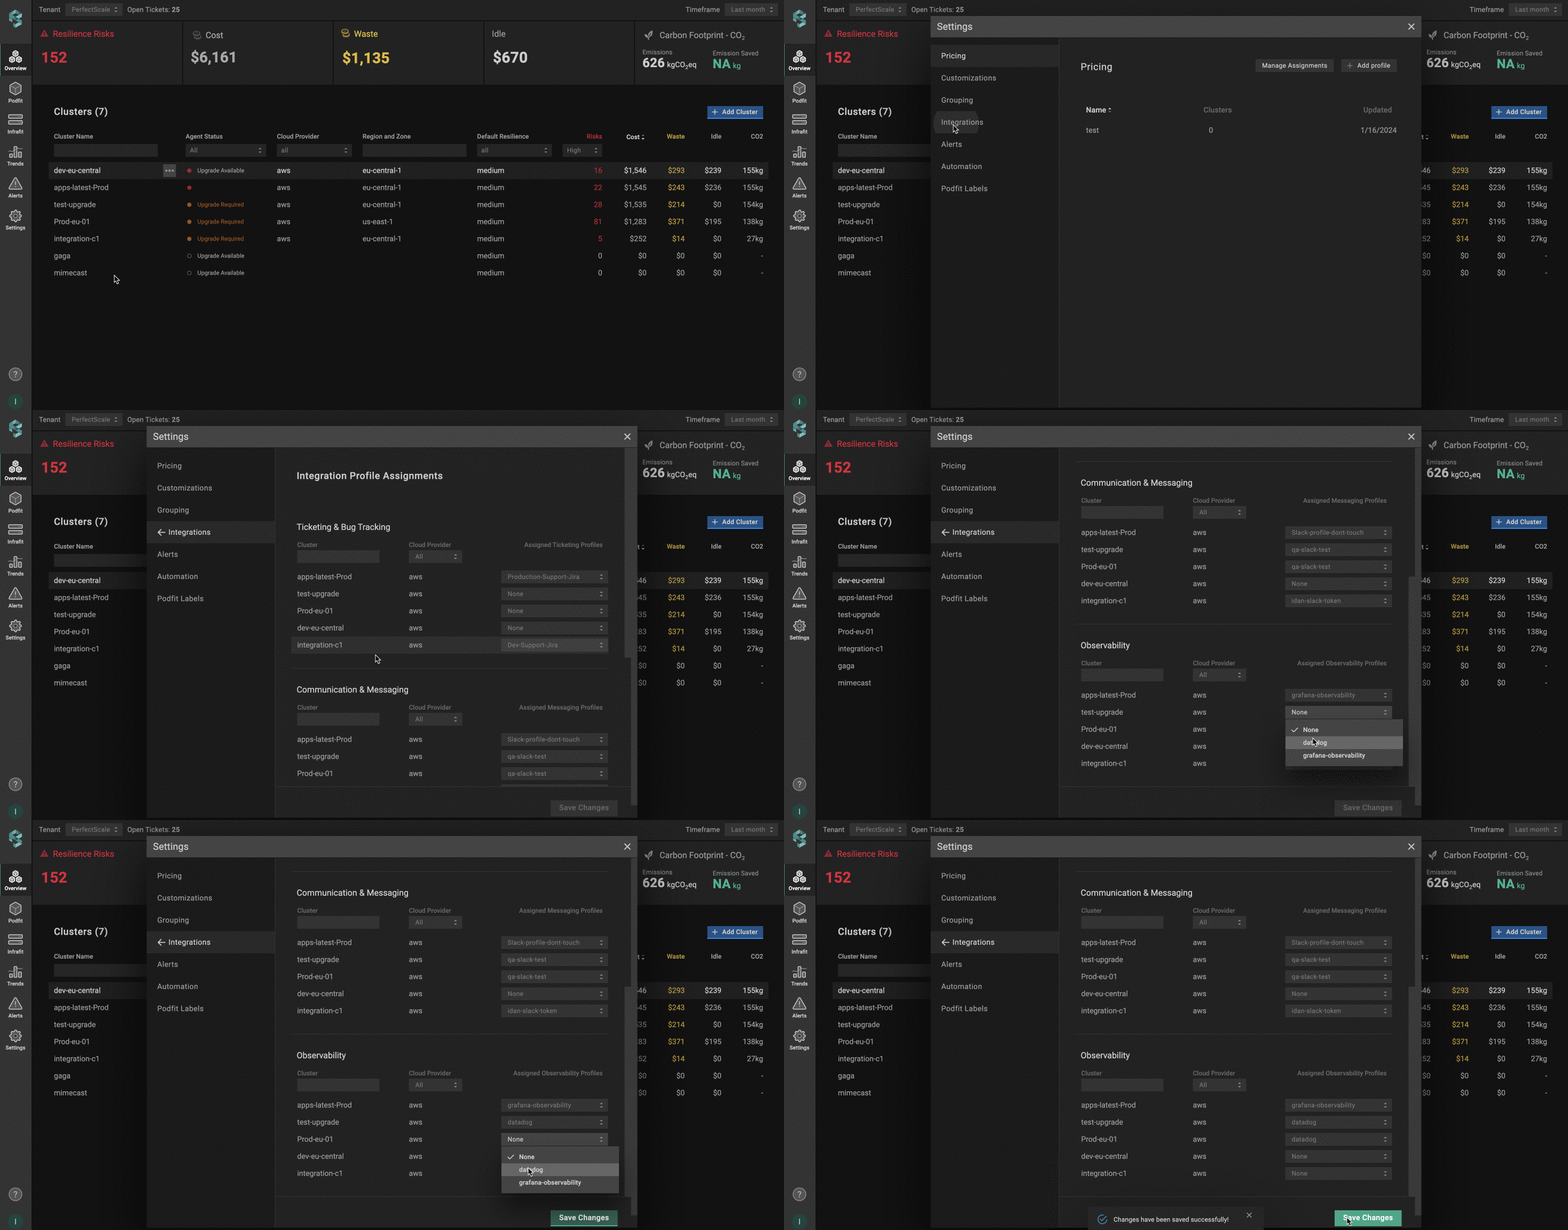
Applying observability profile to multiple clusters
Configuring Observability with CRD
To configure Observability integration using a Custom Resource Definition (CRD), you’ll need to define and apply a Custom Resource (CR) with the required parameters. This approach allows you to manage Observability integration directly through Kubernetes manifests.
The Custom Resource (CR) must be created in the perfectscale namespace.
Setup instructions
- Go to the repository: https://github.com/perfectscale-io/observability
- Download the dashboard (Grafana or Datadog).
- Import the downloaded dashboard into your Grafana or Datadog instance.
- Configure the CR.
apiVersion: perfectscale.io/v1
kind: ClusterSettings
metadata:
  name: cluster-settings-main
  namespace: perfectscale
spec:
  profiles:
    integrations:
      - type: observability
        name: custom-observability-platform
        assigned: true
        value:
          # URL to your observability dashboard (Grafana or DataDog)
          url: "https://observability.mycompany.com/dashboard"
⚙️ CR parameters:
| Parameter | Description |
|---|---|
url | The link to your observability dashboard (Grafana or Datadog). |
💡 How to use Observability
In order to utilize the Observability Integration Profile, it must first be applied to the cluster.
To access the detailed data of a specific cluster using an observability tool (for example, Grafana), navigate to the Overview tab on the left panel and click on the needed cluster.
You will navigate directly to the list of cluster workloads. Select any workload to bring up the workload zoom-in window.

View in observability
Click on the Actions menu and select View in Observability to be directly taken to the relevant dashboard of your observability tool.